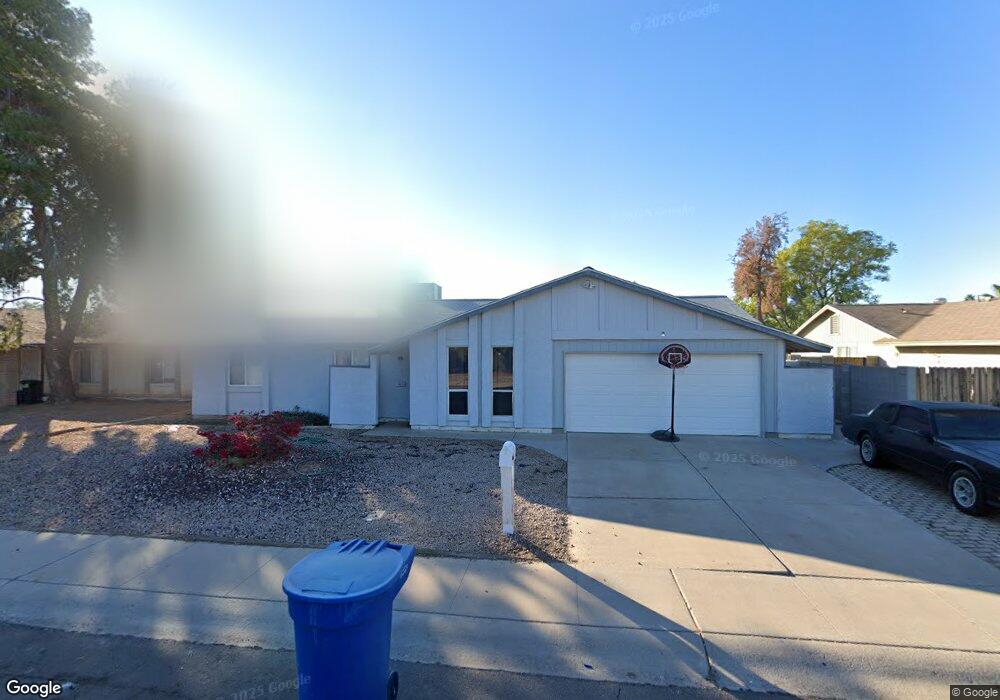
1415 W Colt Rd Chandler, AZ 85224
Amberwood NeighborhoodEstimated Value: $394,713 - $489,000
3
Beds
2
Baths
1,378
Sq Ft
$328/Sq Ft
Est. Value
About This Home
This home is located at 1415 W Colt Rd, Chandler, AZ 85224 and is currently estimated at $451,428, approximately $327 per square foot. 1415 W Colt Rd is a home located in Maricopa County with nearby schools including Pomeroy Elementary School, Franklin at Brimhall Elementary School, and Summit Academy Elementary.
Ownership History
Date
Name
Owned For
Owner Type
Purchase Details
Closed on
Jun 12, 2008
Sold by
Rulffes Walter Craig
Bought by
Rulffes Debra L
Current Estimated Value
Home Financials for this Owner
Home Financials are based on the most recent Mortgage that was taken out on this home.
Original Mortgage
$109,800
Outstanding Balance
$70,458
Interest Rate
6.05%
Mortgage Type
New Conventional
Estimated Equity
$380,970
Purchase Details
Closed on
Dec 12, 2001
Sold by
Rulffes Debra L and Slocum Debra L
Bought by
Rulffes Walter Craig and Rulffes Debra L
Purchase Details
Closed on
Jun 10, 1998
Sold by
Sell Mary Anne
Bought by
Slocum Debra L
Home Financials for this Owner
Home Financials are based on the most recent Mortgage that was taken out on this home.
Original Mortgage
$100,700
Interest Rate
7.17%
Mortgage Type
New Conventional
Create a Home Valuation Report for This Property
The Home Valuation Report is an in-depth analysis detailing your home's value as well as a comparison with similar homes in the area
Home Values in the Area
Average Home Value in this Area
Purchase History
| Date | Buyer | Sale Price | Title Company |
|---|---|---|---|
| Rulffes Debra L | -- | Chicago Title | |
| Rulffes Walter Craig | -- | -- | |
| Slocum Debra L | $106,000 | Security Title Agency |
Source: Public Records
Mortgage History
| Date | Status | Borrower | Loan Amount |
|---|---|---|---|
| Open | Rulffes Debra L | $109,800 | |
| Closed | Slocum Debra L | $100,700 |
Source: Public Records
Tax History Compared to Growth
Tax History
| Year | Tax Paid | Tax Assessment Tax Assessment Total Assessment is a certain percentage of the fair market value that is determined by local assessors to be the total taxable value of land and additions on the property. | Land | Improvement |
|---|---|---|---|---|
| 2025 | $1,524 | $15,108 | -- | -- |
| 2024 | $1,527 | $14,388 | -- | -- |
| 2023 | $1,527 | $33,330 | $6,660 | $26,670 |
| 2022 | $1,489 | $24,900 | $4,980 | $19,920 |
| 2021 | $1,480 | $21,800 | $4,360 | $17,440 |
| 2020 | $1,463 | $19,850 | $3,970 | $15,880 |
| 2019 | $1,360 | $18,230 | $3,640 | $14,590 |
| 2018 | $1,324 | $16,500 | $3,300 | $13,200 |
| 2017 | $1,277 | $15,260 | $3,050 | $12,210 |
| 2016 | $1,249 | $14,360 | $2,870 | $11,490 |
| 2015 | $1,171 | $14,050 | $2,810 | $11,240 |
Source: Public Records
Map
Nearby Homes
- 1417 W Los Arboles Place
- 1403 W Los Arboles Place
- 1511 W Mesquite St
- 2201 N Comanche Dr Unit 1080
- 2201 N Comanche Dr Unit 1104
- 2201 N Comanche Dr Unit 1018
- 2201 N Comanche Dr Unit 1002
- 2015 N Villas Ln
- 2129 N Villas Ln
- 1224 W Mesquite St
- 1214 W Estrella Dr
- 1771 W Mariposa Ct
- 1645 N Saguaro St
- 1621 N Longmore St
- 1624 N Calle Cir
- 1714 N Pleasant Dr
- 1621 N Chippewa Dr
- 1719 N Cholla St
- 812 W Rosal Place
- 1323 W Manor St
- 1413 W Colt Rd
- 1417 W Colt Rd
- 1410 W Los Arboles Place
- 1411 W Colt Rd
- 1419 W Colt Rd
- 1408 W Los Arboles Place
- 1414 W Colt Rd
- 1412 W Colt Rd
- 1416 W Colt Rd
- 1409 W Colt Rd
- 1410 W Colt Rd
- 1421 W Colt Rd
- 2302 N Los Arboles Place
- 2421 N Los Arboles Place
- 2370 N Los Arboles Place
- 1418 W Colt Rd
- 1412 W Los Arboles Place
- 2002 N Los Arboles Ct
- 2004 N Los Arboles Ct
- 1406 W Los Arboles Place