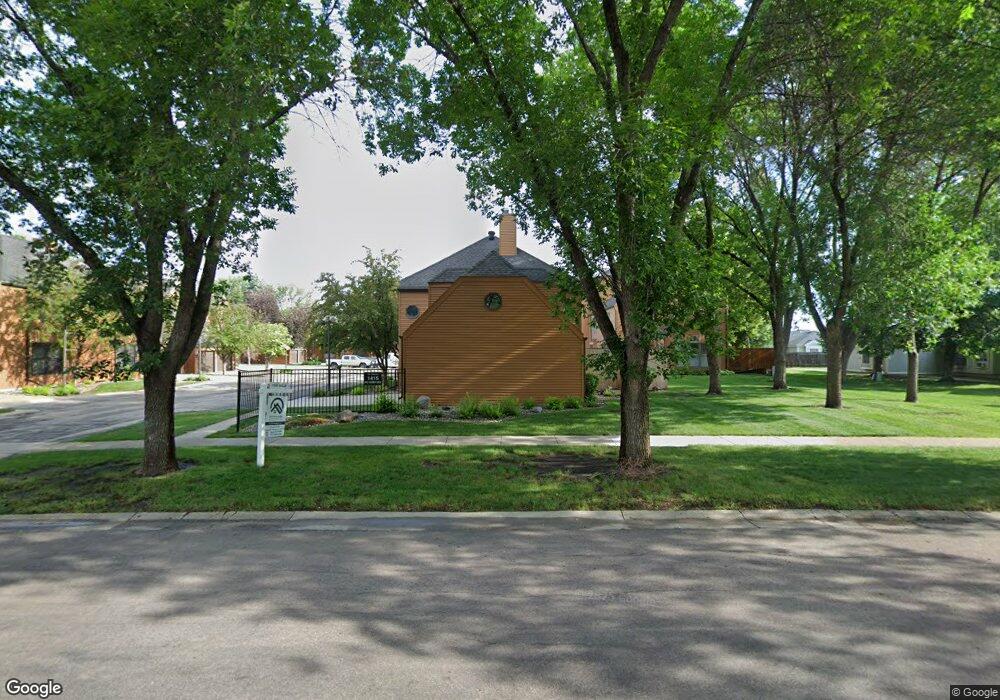
1415 W Gateway Cir S Unit 5 Fargo, ND 58103
Westgate NeighborhoodEstimated Value: $176,634 - $251,000
2
Beds
2
Baths
1,036
Sq Ft
$200/Sq Ft
Est. Value
About This Home
This home is located at 1415 W Gateway Cir S Unit 5, Fargo, ND 58103 and is currently estimated at $207,409, approximately $200 per square foot. 1415 W Gateway Cir S Unit 5 is a home located in Cass County with nearby schools including Lewis & Clark Elementary School, Carl Ben Eielson Middle School, and South High School.
Ownership History
Date
Name
Owned For
Owner Type
Purchase Details
Closed on
Apr 15, 2014
Sold by
Newby Karissa K
Bought by
Johnston Richard M and Johnston Helena M
Current Estimated Value
Home Financials for this Owner
Home Financials are based on the most recent Mortgage that was taken out on this home.
Original Mortgage
$106,320
Outstanding Balance
$80,495
Interest Rate
4.31%
Mortgage Type
New Conventional
Estimated Equity
$126,914
Purchase Details
Closed on
Feb 21, 2008
Sold by
Hannestad Robert D and Hannestad Deborah
Bought by
Newby Karissa K
Home Financials for this Owner
Home Financials are based on the most recent Mortgage that was taken out on this home.
Original Mortgage
$116,556
Interest Rate
5.9%
Mortgage Type
FHA
Create a Home Valuation Report for This Property
The Home Valuation Report is an in-depth analysis detailing your home's value as well as a comparison with similar homes in the area
Home Values in the Area
Average Home Value in this Area
Purchase History
| Date | Buyer | Sale Price | Title Company |
|---|---|---|---|
| Johnston Richard M | $132,900 | Northern Title Co | |
| Newby Karissa K | -- | -- |
Source: Public Records
Mortgage History
| Date | Status | Borrower | Loan Amount |
|---|---|---|---|
| Open | Johnston Richard M | $106,320 | |
| Previous Owner | Newby Karissa K | $116,556 |
Source: Public Records
Tax History Compared to Growth
Tax History
| Year | Tax Paid | Tax Assessment Tax Assessment Total Assessment is a certain percentage of the fair market value that is determined by local assessors to be the total taxable value of land and additions on the property. | Land | Improvement |
|---|---|---|---|---|
| 2024 | $1,661 | $77,950 | $5,200 | $72,750 |
| 2023 | $2,150 | $77,950 | $5,200 | $72,750 |
| 2022 | $1,985 | $70,850 | $5,200 | $65,650 |
| 2021 | $2,071 | $75,400 | $16,550 | $58,850 |
| 2020 | $1,832 | $67,300 | $16,550 | $50,750 |
| 2019 | $1,834 | $67,300 | $10,350 | $56,950 |
| 2018 | $1,811 | $67,300 | $10,350 | $56,950 |
| 2017 | $1,710 | $64,100 | $10,350 | $53,750 |
| 2016 | $1,509 | $62,250 | $10,350 | $51,900 |
| 2015 | $1,377 | $53,400 | $7,050 | $46,350 |
| 2014 | $1,411 | $53,400 | $7,050 | $46,350 |
| 2013 | $1,414 | $53,400 | $7,050 | $46,350 |
Source: Public Records
Map
Nearby Homes
- 1402 E Gateway Cir S Unit M
- 2867 Westgate Dr S
- 3305 15th Ave S Unit B
- 3311 15th Ave S Unit E
- 3249 16th Ave S Unit 4
- 2402 N Flickertail Dr S Unit 1
- 21 Birch Ln S
- 3237 17th Ave S Unit 101
- 3253 17th Ave S Unit 101
- 3253 17th Ave S Unit 102
- 2202 15th Ave S
- 1129 22nd St S Unit B09
- 1129 22nd St S Unit B12
- 2013 13th Ave S
- 3420 17th Ave S Unit A
- 3325 W Prairiewood Dr S
- 1737 Park Blvd S
- 1407 17th St S
- 2209 6th Ave S
- 2213 5th Ave S
- 1415 W Gateway Cir S Unit 1
- 1415 W Gateway Cir S Unit 24
- 1415 W Gateway Cir S Unit 23
- 1415 W Gateway Cir S Unit 22
- 1415 W Gateway Cir S Unit 20
- 1415 W Gateway Cir S Unit 19
- 1415 W Gateway Cir S Unit 18
- 1415 W Gateway Cir S Unit 17
- 1415 W Gateway Cir S Unit 16
- 1415 W Gateway Cir S Unit 15
- 1415 W Gateway Cir S Unit 14
- 1415 W Gateway Cir S Unit 13
- 1415 W Gateway Cir S Unit 12
- 1415 W Gateway Cir S Unit 11
- 1415 W Gateway Cir S Unit 10
- 1415 W Gateway Cir S Unit 9
- 1415 W Gateway Cir S Unit 8
- 1415 W Gateway Cir S Unit 7
- 1415 W Gateway Cir S Unit 6
- 1415 W Gateway Cir S Unit 4