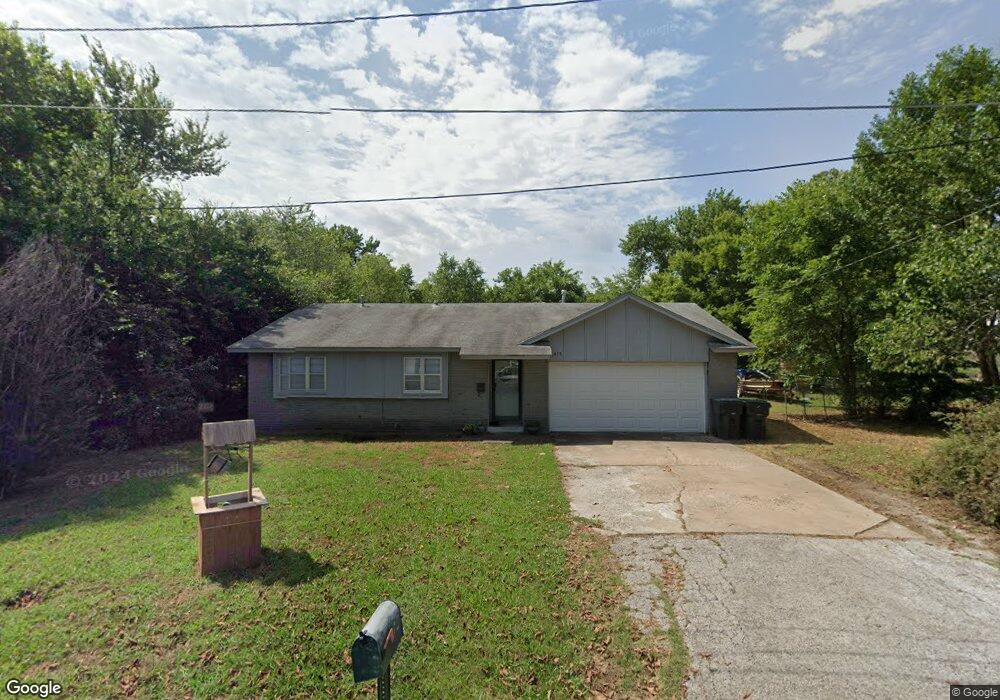
1415 W Strain St Claremore, OK 74017
Estimated Value: $147,054 - $183,000
3
Beds
1
Bath
1,038
Sq Ft
$154/Sq Ft
Est. Value
About This Home
This home is located at 1415 W Strain St, Claremore, OK 74017 and is currently estimated at $160,264, approximately $154 per square foot. 1415 W Strain St is a home located in Rogers County with nearby schools including Westside Elementary School, Will Rogers Junior High School, and Claremore High School.
Ownership History
Date
Name
Owned For
Owner Type
Purchase Details
Closed on
Jan 3, 2007
Sold by
Ministry In Motion Inc
Bought by
Santos Connie and Santos Gregory R
Current Estimated Value
Home Financials for this Owner
Home Financials are based on the most recent Mortgage that was taken out on this home.
Original Mortgage
$60,800
Outstanding Balance
$35,943
Interest Rate
6.2%
Mortgage Type
New Conventional
Estimated Equity
$124,321
Purchase Details
Closed on
Dec 29, 2006
Sold by
Thomas Steven J and Thomas Phara L
Bought by
Thomas Benjamin M
Home Financials for this Owner
Home Financials are based on the most recent Mortgage that was taken out on this home.
Original Mortgage
$60,800
Outstanding Balance
$35,943
Interest Rate
6.2%
Mortgage Type
New Conventional
Estimated Equity
$124,321
Purchase Details
Closed on
Oct 9, 2006
Sold by
Thomas Steven J and Thomas Benjamin M
Bought by
Ministry In Motion Inc
Create a Home Valuation Report for This Property
The Home Valuation Report is an in-depth analysis detailing your home's value as well as a comparison with similar homes in the area
Home Values in the Area
Average Home Value in this Area
Purchase History
| Date | Buyer | Sale Price | Title Company |
|---|---|---|---|
| Santos Connie | $76,000 | Anchor Title & Closing | |
| Thomas Benjamin M | -- | None Available | |
| Ministry In Motion Inc | -- | None Available | |
| Thomas Steven J | -- | None Available |
Source: Public Records
Mortgage History
| Date | Status | Borrower | Loan Amount |
|---|---|---|---|
| Open | Santos Connie | $60,800 |
Source: Public Records
Tax History Compared to Growth
Tax History
| Year | Tax Paid | Tax Assessment Tax Assessment Total Assessment is a certain percentage of the fair market value that is determined by local assessors to be the total taxable value of land and additions on the property. | Land | Improvement |
|---|---|---|---|---|
| 2025 | $1,036 | $11,206 | $3,311 | $7,895 |
| 2024 | $986 | $10,672 | $3,153 | $7,519 |
| 2023 | $986 | $10,164 | $2,940 | $7,224 |
| 2022 | $896 | $9,680 | $2,310 | $7,370 |
| 2021 | $854 | $9,673 | $2,310 | $7,363 |
| 2020 | $869 | $9,495 | $2,063 | $7,432 |
| 2019 | $848 | $9,156 | $2,063 | $7,093 |
| 2018 | $881 | $9,530 | $2,063 | $7,467 |
| 2017 | $869 | $9,458 | $2,063 | $7,395 |
| 2016 | $867 | $9,240 | $2,063 | $7,177 |
| 2015 | $835 | $9,006 | $2,063 | $6,943 |
| 2014 | $820 | $8,840 | $2,063 | $6,777 |
Source: Public Records
Map
Nearby Homes
- 1420 W Haskell St
- 1206 W Haskell St
- 205 N Kates Ave
- 208 N Chambers Trail
- 1230 W Dupont St
- 2006 W Driftwood Dr
- 2207 Pecan Chase Cir
- 902 W 8th St
- 1606 N Chambers Terrace
- 1410 W Danny St
- 1906 Memorial Dr
- 2404 S Maywood Dr
- 602 Rosewood Ct
- 1520 Greenleaf St
- 612 Westwood Dr
- 2701 Ridgeview Place
- 1103 W 20th St
- 1112 W 20th St
- 119 N Missouri Ave
- 0 N J M Davis Blvd
- 1425 W Strain St
- 1411 W Strain St
- 311 S Davis Ave
- 1412 W Quarles St
- 1416 W Strain St
- 1412 W Strain St
- 1408 W Quarles St
- 320 S Moore Ave
- 1402 W Strain St
- 218 S Moore Ave
- 223 S Davis Ave
- 0 S Davis Ave
- 1326 W Quarles St
- 1427 W Quarles St
- 1425 W Quarles St
- 1421 W Lillian St
- 1413 W Quarles St
- 1401 W Lillian St
- 222 S Davis Ave
- 1411 W Quarles St