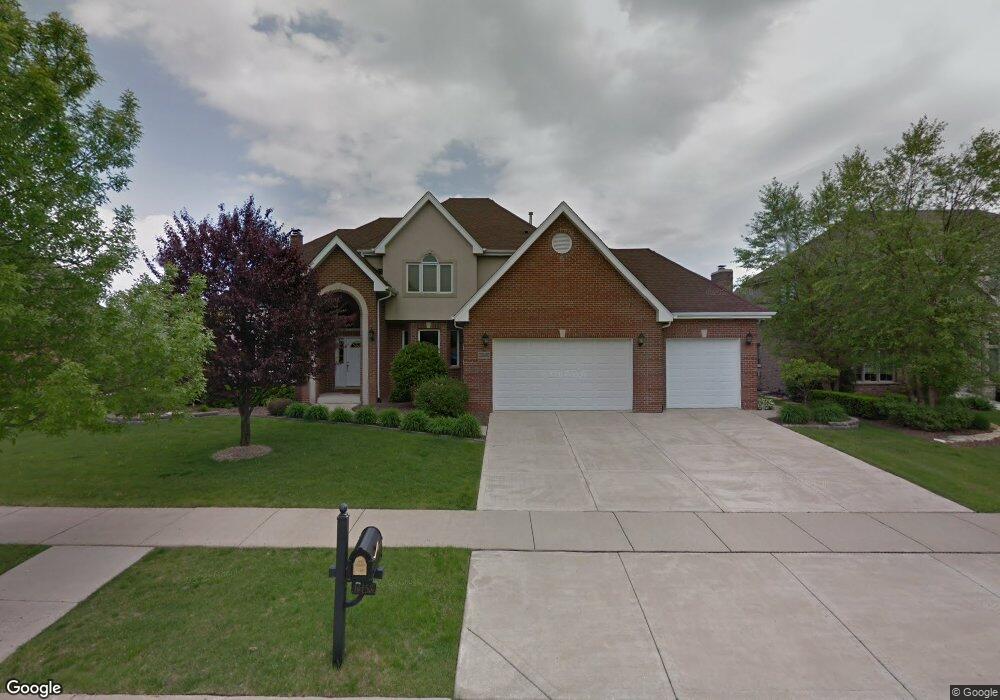
14153 S 88th Ave Orland Park, IL 60462
Silver Lake North NeighborhoodEstimated Value: $590,000 - $727,000
4
Beds
3
Baths
2,878
Sq Ft
$237/Sq Ft
Est. Value
About This Home
This home is located at 14153 S 88th Ave, Orland Park, IL 60462 and is currently estimated at $681,964, approximately $236 per square foot. 14153 S 88th Ave is a home located in Cook County with nearby schools including Prairie Elementary School, Liberty Elementary School, and Jerling Junior High School.
Ownership History
Date
Name
Owned For
Owner Type
Purchase Details
Closed on
Apr 11, 2023
Sold by
Knize Robert D
Bought by
Robert D Knize Revocable Trust
Current Estimated Value
Purchase Details
Closed on
Jan 6, 2012
Sold by
Welch Christopher
Bought by
Knize Robert
Home Financials for this Owner
Home Financials are based on the most recent Mortgage that was taken out on this home.
Original Mortgage
$344,000
Interest Rate
2.87%
Mortgage Type
Adjustable Rate Mortgage/ARM
Purchase Details
Closed on
Jul 3, 2010
Sold by
Welch Christopher and Welch Kelly M
Bought by
Welch Christopher
Purchase Details
Closed on
Dec 9, 2002
Sold by
State Bank Of Countryside
Bought by
Welch Christopher
Home Financials for this Owner
Home Financials are based on the most recent Mortgage that was taken out on this home.
Original Mortgage
$100,000
Interest Rate
6.01%
Create a Home Valuation Report for This Property
The Home Valuation Report is an in-depth analysis detailing your home's value as well as a comparison with similar homes in the area
Home Values in the Area
Average Home Value in this Area
Purchase History
| Date | Buyer | Sale Price | Title Company |
|---|---|---|---|
| Robert D Knize Revocable Trust | -- | None Listed On Document | |
| Knize Robert | $460,000 | None Available | |
| Welch Christopher | -- | Chicago Title Insurance Co | |
| Welch Christopher | $424,000 | Enterprise Land Title Ltd |
Source: Public Records
Mortgage History
| Date | Status | Borrower | Loan Amount |
|---|---|---|---|
| Previous Owner | Knize Robert | $344,000 | |
| Previous Owner | Welch Christopher | $100,000 |
Source: Public Records
Tax History Compared to Growth
Tax History
| Year | Tax Paid | Tax Assessment Tax Assessment Total Assessment is a certain percentage of the fair market value that is determined by local assessors to be the total taxable value of land and additions on the property. | Land | Improvement |
|---|---|---|---|---|
| 2024 | $13,146 | $58,499 | $9,113 | $49,386 |
| 2023 | $9,160 | $62,001 | $9,113 | $52,888 |
| 2022 | $9,160 | $36,736 | $7,898 | $28,838 |
| 2021 | $8,893 | $36,735 | $7,897 | $28,838 |
| 2020 | $10,130 | $41,960 | $7,897 | $34,063 |
| 2019 | $10,661 | $45,014 | $7,290 | $37,724 |
| 2018 | $10,366 | $45,014 | $7,290 | $37,724 |
| 2017 | $10,160 | $45,014 | $7,290 | $37,724 |
| 2016 | $9,600 | $36,901 | $6,682 | $30,219 |
| 2015 | $10,488 | $40,576 | $6,682 | $33,894 |
| 2014 | $10,348 | $40,576 | $6,682 | $33,894 |
| 2013 | $12,791 | $49,905 | $6,682 | $43,223 |
Source: Public Records
Map
Nearby Homes
- 14040 Boxwood Ln
- 8700 Berkley Ct
- 14111 Tod William Dr
- 8603 W 142nd St
- 8820 W 140th St Unit 2A
- 14345 S 87th Ave
- 14216 Clearview Dr
- 14034 S 84th Ave
- 14304 Clearview Ct Unit 8904
- 8810 Clearview Dr Unit 8810
- 14453 S 88th Ave
- 14508 Maycliff Dr
- 8932 Pebble Beach Ln
- 9114 W 140th St Unit 204
- 14402 S 90th Ct Unit 1A
- 14340 Mason Ln
- 14350 Mason Ln
- 9146 W 140th St Unit 3NE
- 14023 Chelsea Dr
- 14440 Brentwood St
- 14161 S 88th Ave
- 14145 S 88th Ave
- 14150 S 87th Place
- 14140 S 87th Place
- 14160 S 87th Place
- 14201 S 88th Ave
- 14150 S 88th Ave
- 14160 S 88th Ave
- 14200 S 87th Place
- 14140 S 88th Ave
- 8750 W 141st Place
- 14211 S 88th Ave
- 8740 W 141st Place
- 14200 S 88th Ave
- 14210 S 87th Place Unit 1
- 8730 W 141st Place Unit 1
- 14130 S 88th Ave
- 14151 S 87th Place
- 14141 S 87th Place
- 14161 S 87th Place