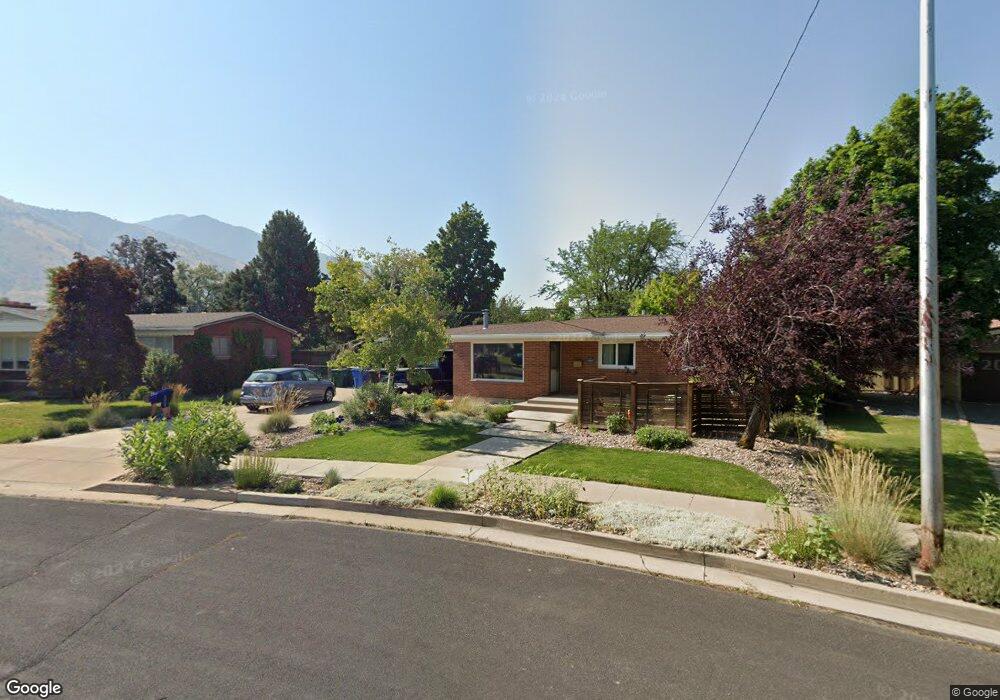
1416 E 800 N Logan, UT 84321
Hillcrest NeighborhoodEstimated Value: $365,427 - $438,000
4
Beds
2
Baths
2,036
Sq Ft
$199/Sq Ft
Est. Value
About This Home
This home is located at 1416 E 800 N, Logan, UT 84321 and is currently estimated at $404,607, approximately $198 per square foot. 1416 E 800 N is a home located in Cache County with nearby schools including Hillcrest Elementary School, Mount Logan Middle School, and Logan High School.
Ownership History
Date
Name
Owned For
Owner Type
Purchase Details
Closed on
May 3, 2019
Sold by
Fryer Melody Jean
Bought by
Melody Fryer Llc
Current Estimated Value
Purchase Details
Closed on
Dec 22, 2015
Sold by
Cassady Lincoln and Moore Caron
Bought by
Moore Caron
Home Financials for this Owner
Home Financials are based on the most recent Mortgage that was taken out on this home.
Original Mortgage
$153,937
Interest Rate
3.75%
Mortgage Type
FHA
Create a Home Valuation Report for This Property
The Home Valuation Report is an in-depth analysis detailing your home's value as well as a comparison with similar homes in the area
Home Values in the Area
Average Home Value in this Area
Purchase History
| Date | Buyer | Sale Price | Title Company |
|---|---|---|---|
| Melody Fryer Llc | -- | Cache Title Company Inc | |
| Fryer Melody Jean | -- | Cache Title Company Inc | |
| Moore Caron | -- | Advanced Title |
Source: Public Records
Mortgage History
| Date | Status | Borrower | Loan Amount |
|---|---|---|---|
| Previous Owner | Moore Caron | $153,937 |
Source: Public Records
Tax History Compared to Growth
Tax History
| Year | Tax Paid | Tax Assessment Tax Assessment Total Assessment is a certain percentage of the fair market value that is determined by local assessors to be the total taxable value of land and additions on the property. | Land | Improvement |
|---|---|---|---|---|
| 2024 | $1,727 | $216,345 | $0 | $0 |
| 2023 | $1,802 | $215,135 | $0 | $0 |
| 2022 | $1,708 | $190,385 | $0 | $0 |
| 2021 | $1,586 | $273,260 | $65,000 | $208,260 |
| 2020 | $1,453 | $225,200 | $65,000 | $160,200 |
| 2019 | $1,518 | $225,200 | $65,000 | $160,200 |
| 2018 | $1,423 | $192,680 | $65,000 | $127,680 |
| 2017 | $1,229 | $88,000 | $0 | $0 |
| 2016 | $1,274 | $88,000 | $0 | $0 |
| 2015 | $1,276 | $88,000 | $0 | $0 |
| 2014 | $1,153 | $88,000 | $0 | $0 |
| 2013 | -- | $86,745 | $0 | $0 |
Source: Public Records
Map
Nearby Homes
- 813 N 1400 E
- 825 N 1400 E
- 1393 Davis Ave
- 975 N 1600 E
- 1254 Island Dr
- 1357 E 1220 N
- 1336 E 1220 N
- 240 N 1480 E
- 1387 E 260 N
- 1273 Cedar Heights Dr
- 1395 E Talmage Ln Unit 31
- 1045 Fox Farm Rd
- 1440 N 1600 E
- 871 N 700 E
- 10 S 1300 E
- 1561 N 1525 E
- 1405 N Aspen Dr
- 1315 E 1550 N
- 661 E 600 N
- 147 Winding Way Unit 50