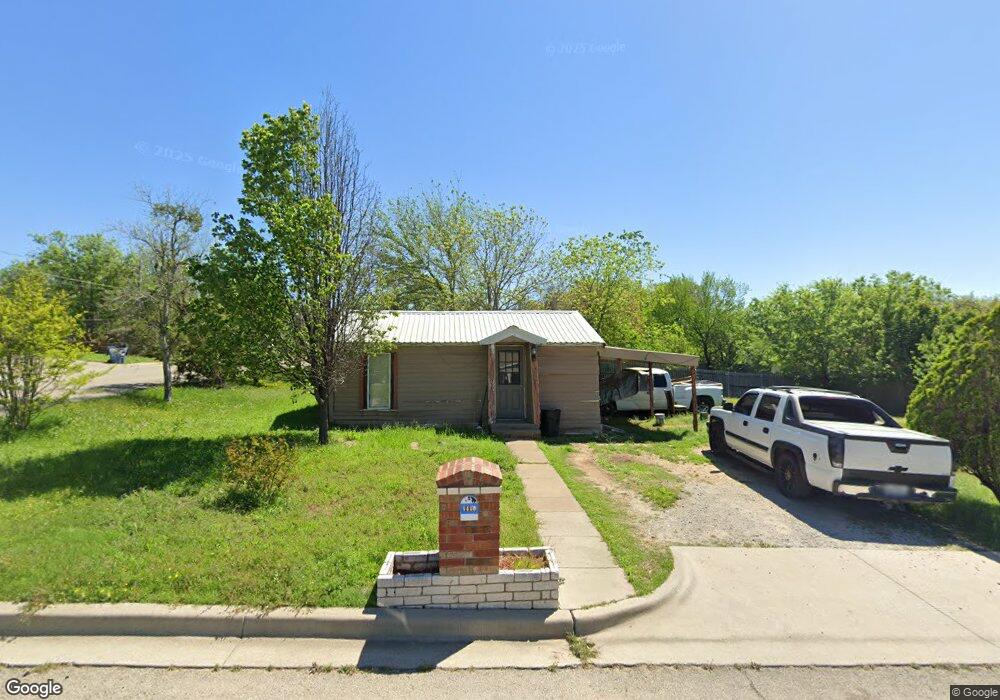
1416 Hanover St Weatherford, TX 76086
Estimated Value: $132,169 - $230,000
--
Bed
--
Bath
511
Sq Ft
$332/Sq Ft
Est. Value
About This Home
This home is located at 1416 Hanover St, Weatherford, TX 76086 and is currently estimated at $169,792, approximately $332 per square foot. 1416 Hanover St is a home located in Parker County with nearby schools including Seguin Elementary School, Tison Middle School, and Weatherford High School.
Ownership History
Date
Name
Owned For
Owner Type
Purchase Details
Closed on
Feb 1, 2008
Sold by
Calhoun Larry H and Calhoun Elsie
Bought by
Sanchez Ana I
Current Estimated Value
Home Financials for this Owner
Home Financials are based on the most recent Mortgage that was taken out on this home.
Original Mortgage
$7,531
Interest Rate
5.72%
Mortgage Type
Seller Take Back
Purchase Details
Closed on
Jul 1, 1998
Bought by
Sanchez Ana I
Purchase Details
Closed on
Oct 10, 1996
Bought by
Sanchez Ana I
Purchase Details
Closed on
Jan 1, 1901
Bought by
Sanchez Ana I
Create a Home Valuation Report for This Property
The Home Valuation Report is an in-depth analysis detailing your home's value as well as a comparison with similar homes in the area
Home Values in the Area
Average Home Value in this Area
Purchase History
| Date | Buyer | Sale Price | Title Company |
|---|---|---|---|
| Sanchez Ana I | -- | -- | |
| Sanchez Ana I | -- | None Available | |
| Sanchez Ana I | -- | -- | |
| Sanchez Ana I | -- | -- | |
| Sanchez Ana I | -- | -- |
Source: Public Records
Mortgage History
| Date | Status | Borrower | Loan Amount |
|---|---|---|---|
| Previous Owner | Sanchez Ana I | $7,531 |
Source: Public Records
Tax History Compared to Growth
Tax History
| Year | Tax Paid | Tax Assessment Tax Assessment Total Assessment is a certain percentage of the fair market value that is determined by local assessors to be the total taxable value of land and additions on the property. | Land | Improvement |
|---|---|---|---|---|
| 2025 | $2,379 | $153,790 | $50,000 | $103,790 |
| 2024 | $2,379 | $123,420 | $40,000 | $83,420 |
| 2023 | $2,379 | $123,420 | $40,000 | $83,420 |
| 2022 | $998 | $44,970 | $15,000 | $29,970 |
| 2021 | $1,080 | $44,970 | $15,000 | $29,970 |
| 2020 | $958 | $39,660 | $15,000 | $24,660 |
| 2019 | $1,013 | $39,660 | $15,000 | $24,660 |
| 2018 | $906 | $35,330 | $15,000 | $20,330 |
| 2017 | $930 | $35,330 | $15,000 | $20,330 |
| 2016 | $831 | $31,570 | $15,000 | $16,570 |
| 2015 | $813 | $31,570 | $15,000 | $16,570 |
| 2014 | $769 | $30,640 | $15,000 | $15,640 |
Source: Public Records
Map
Nearby Homes