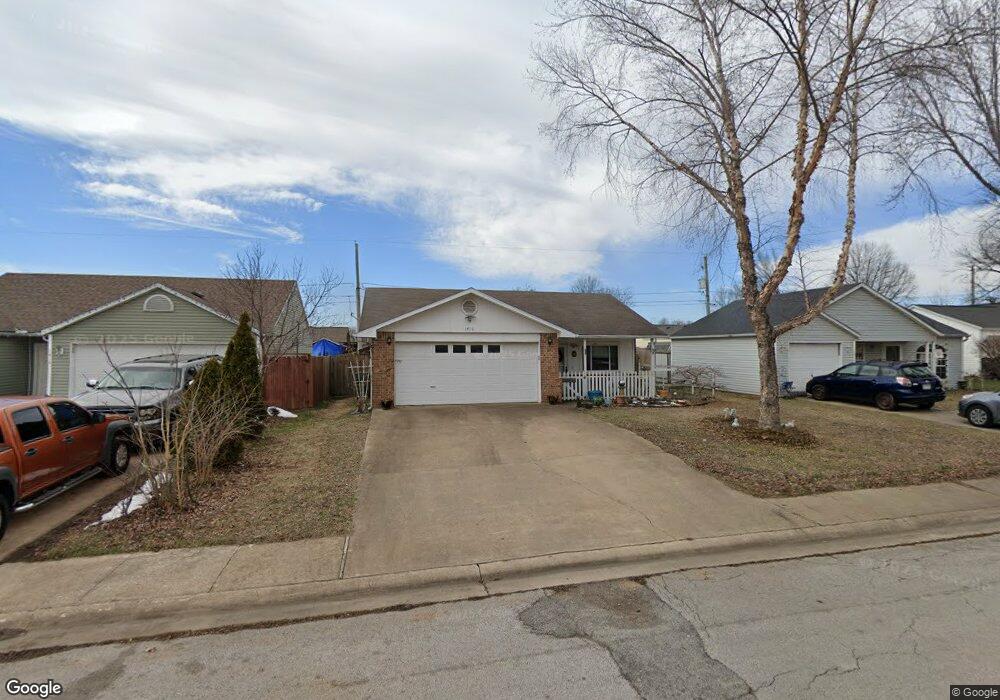
1416 S B St Rogers, AR 72756
Estimated Value: $217,000 - $243,000
Studio
2
Baths
940
Sq Ft
$244/Sq Ft
Est. Value
About This Home
This home is located at 1416 S B St, Rogers, AR 72756 and is currently estimated at $229,314, approximately $243 per square foot. 1416 S B St is a home located in Benton County with nearby schools including Frank Tillery Elementary School, Lingle Middle School, and Rogers Heritage High School.
Ownership History
Date
Name
Owned For
Owner Type
Purchase Details
Closed on
Jul 13, 2021
Sold by
Lewis Jack R
Bought by
Lewis Maxine G
Current Estimated Value
Purchase Details
Closed on
Jan 26, 2005
Sold by
Gastineau Zelma
Bought by
Gastineau Zelma and Gastineau Carl A
Purchase Details
Closed on
Aug 19, 1996
Bought by
Gastineau
Purchase Details
Closed on
Jul 6, 1994
Bought by
Partin L
Purchase Details
Closed on
Jan 18, 1994
Bought by
Bell
Purchase Details
Closed on
Sep 4, 1992
Bought by
Swb Inc
Create a Home Valuation Report for This Property
The Home Valuation Report is an in-depth analysis detailing your home's value as well as a comparison with similar homes in the area
Home Values in the Area
Average Home Value in this Area
Purchase History
| Date | Buyer | Sale Price | Title Company |
|---|---|---|---|
| Lewis Maxine G | -- | None Available | |
| Gastineau Zelma | -- | None Available | |
| Gastineau | -- | -- | |
| Partin L | $53,000 | -- | |
| Bell | $8,000 | -- | |
| Swb Inc | $77,000 | -- |
Source: Public Records
Tax History
| Year | Tax Paid | Tax Assessment Tax Assessment Total Assessment is a certain percentage of the fair market value that is determined by local assessors to be the total taxable value of land and additions on the property. | Land | Improvement |
|---|---|---|---|---|
| 2025 | $692 | $45,584 | $19,000 | $26,584 |
| 2024 | $676 | $45,584 | $19,000 | $26,584 |
| 2023 | $676 | $28,000 | $8,000 | $20,000 |
| 2022 | $327 | $28,000 | $8,000 | $20,000 |
| 2021 | $326 | $28,000 | $8,000 | $20,000 |
| 2020 | $326 | $17,030 | $2,400 | $14,630 |
| 2019 | $326 | $17,030 | $2,400 | $14,630 |
| 2018 | $351 | $17,030 | $2,400 | $14,630 |
| 2017 | $313 | $17,030 | $2,400 | $14,630 |
| 2016 | $313 | $17,030 | $2,400 | $14,630 |
| 2015 | $676 | $13,220 | $3,000 | $10,220 |
| 2014 | $326 | $13,220 | $3,000 | $10,220 |
Source: Public Records
Map
Nearby Homes
Your Personal Tour Guide
Ask me questions while you tour the home.