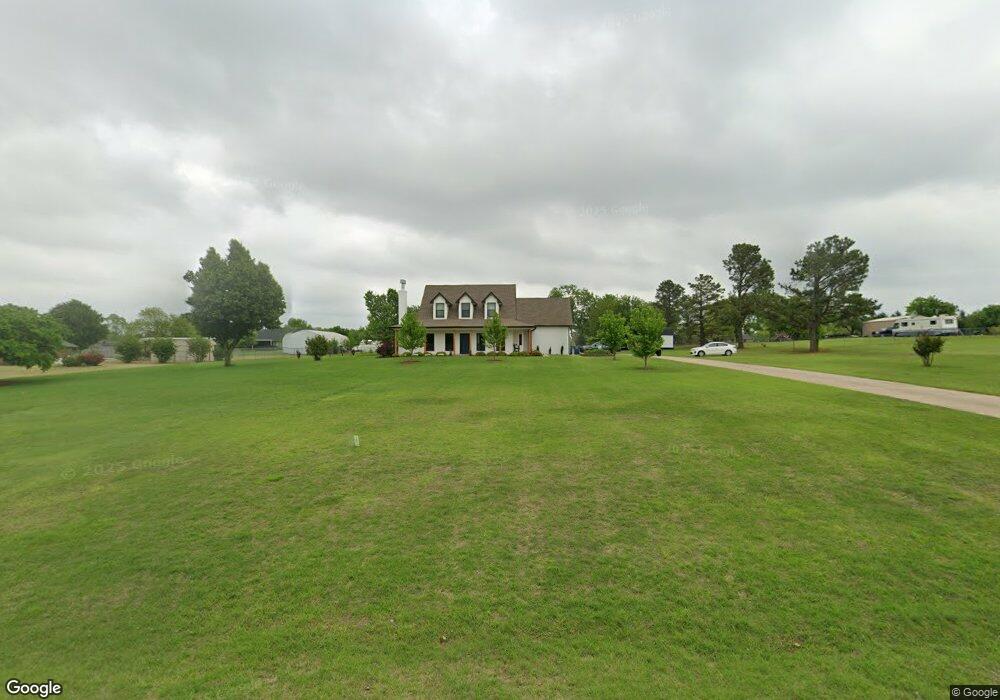
1416 S Ebeling Dr Mustang, OK 73064
Estimated Value: $321,000 - $433,000
4
Beds
3
Baths
2,147
Sq Ft
$167/Sq Ft
Est. Value
About This Home
This home is located at 1416 S Ebeling Dr, Mustang, OK 73064 and is currently estimated at $359,505, approximately $167 per square foot. 1416 S Ebeling Dr is a home located in Canadian County with nearby schools including Mustang Centennial Elementary School, Mustang Horizon Intermediate School, and Mustang Middle School.
Ownership History
Date
Name
Owned For
Owner Type
Purchase Details
Closed on
May 27, 2005
Sold by
Kincaid Jerry A and Kincaid Deborah K
Bought by
Rosebrook Steven L
Current Estimated Value
Home Financials for this Owner
Home Financials are based on the most recent Mortgage that was taken out on this home.
Original Mortgage
$196,166
Outstanding Balance
$102,608
Interest Rate
5.79%
Mortgage Type
VA
Estimated Equity
$256,897
Purchase Details
Closed on
Aug 7, 2000
Sold by
Martin Michael A and Martin Tamela S
Purchase Details
Closed on
Apr 23, 1999
Sold by
Mille James A
Purchase Details
Closed on
May 10, 1996
Sold by
Berry Dale A and Berry Kimberly Y
Purchase Details
Closed on
Nov 29, 1993
Sold by
Owens Gary and Owens Terri
Purchase Details
Closed on
Jun 16, 1993
Sold by
Berry Dale A and Berry Kimberly Y
Purchase Details
Closed on
Oct 17, 1991
Purchase Details
Closed on
May 28, 1991
Purchase Details
Closed on
Oct 21, 1989
Create a Home Valuation Report for This Property
The Home Valuation Report is an in-depth analysis detailing your home's value as well as a comparison with similar homes in the area
Home Values in the Area
Average Home Value in this Area
Purchase History
| Date | Buyer | Sale Price | Title Company |
|---|---|---|---|
| Rosebrook Steven L | $142,500 | None Available | |
| -- | $155,000 | -- | |
| -- | $152,500 | -- | |
| -- | $121,500 | -- | |
| -- | $104,000 | -- | |
| -- | -- | -- | |
| -- | $11,000 | -- | |
| -- | $30,000 | -- | |
| -- | -- | -- |
Source: Public Records
Mortgage History
| Date | Status | Borrower | Loan Amount |
|---|---|---|---|
| Open | Rosebrook Steven L | $196,166 |
Source: Public Records
Tax History Compared to Growth
Tax History
| Year | Tax Paid | Tax Assessment Tax Assessment Total Assessment is a certain percentage of the fair market value that is determined by local assessors to be the total taxable value of land and additions on the property. | Land | Improvement |
|---|---|---|---|---|
| 2024 | -- | $28,577 | $6,000 | $22,577 |
| 2023 | $0 | $27,745 | $6,000 | $21,745 |
| 2022 | $0 | $26,937 | $6,000 | $20,937 |
| 2021 | $0 | $27,199 | $6,000 | $21,199 |
| 2020 | $2,726 | $27,723 | $6,000 | $21,723 |
| 2019 | $2,676 | $27,228 | $6,000 | $21,228 |
| 2018 | $2,651 | $26,435 | $6,000 | $20,435 |
| 2017 | $2,560 | $25,848 | $5,728 | $20,120 |
| 2016 | $2,488 | $25,848 | $5,912 | $19,936 |
| 2015 | $2,352 | $24,364 | $5,172 | $19,192 |
| 2014 | $2,352 | $23,655 | $3,000 | $20,655 |
Source: Public Records
Map
Nearby Homes
- 1315 S Grace Dr
- 525 W Ava Dr
- 1302 S Silver Dr
- 10009 SW 39th St
- 10013 SW 39th St
- 1405 S Dean Dr
- 12100 SW 36th St
- 632 W Carson Dr
- 850 W Forest Dr
- 844 W Forest Dr
- 520 S Owen Dr
- 12116 SW 36th St
- 12112 SW 36th St
- 12108 SW 36th St
- 12104 SW 36th St
- 1509 S Clear Springs Rd
- 635 W Hillcrest Dr
- 613 W Greenwood Ct
- 425 W Linden Dr
- 1907 W Cedar Ridge Dr
- 1502 S Ebeling Dr
- 1421 S Ebeling Dr
- 1333 S Ebeling Dr
- 1508 S Ebeling Dr
- 1325 S Chuckwagon Dr
- 1501 S Chuckwagon Dr
- 1413 Jake Ct
- 1328 S Rae Dr
- 1401 Jake Ct
- 1405 Jake Ct
- 812 W Lola Dr
- 1322 S Grace Dr
- 816 W Lola Dr
- 820 W Lola Dr
- 803 W Lola Dr
- 1324 S Rae Dr
- 1323 S Grace Dr
- 1304 S Rae Dr
- 1319 S Grace Dr
- 1318 S Grace Dr