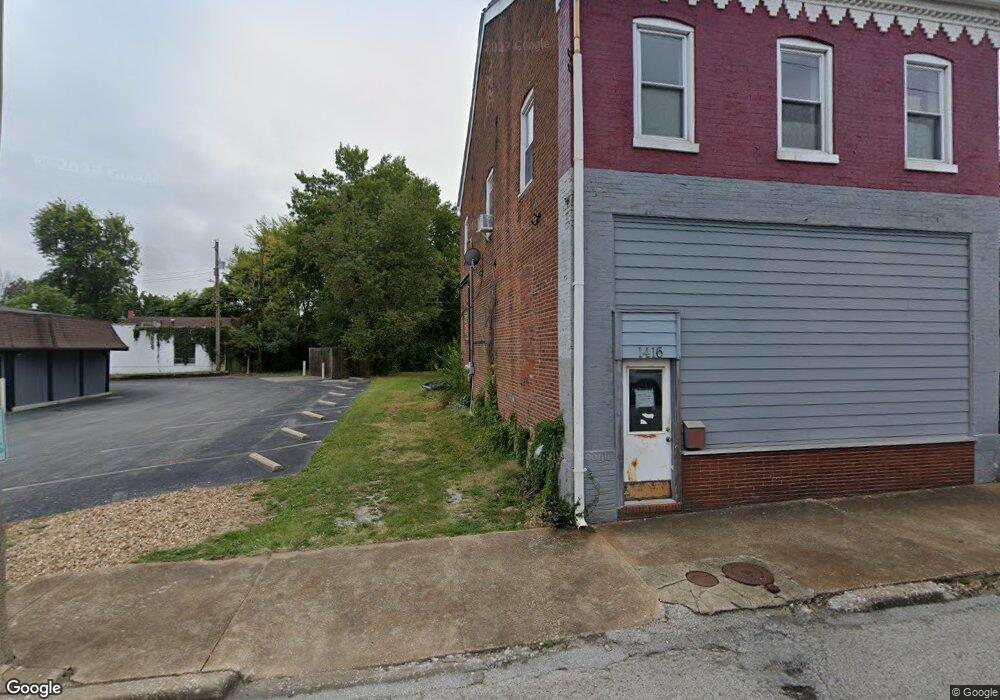
1416 W Main St Belleville, IL 62220
Estimated Value: $64,731
Studio
--
Bath
2,341
Sq Ft
$28/Sq Ft
Est. Value
About This Home
This home is located at 1416 W Main St, Belleville, IL 62220 and is currently estimated at $64,731, approximately $27 per square foot. 1416 W Main St is a home located in St. Clair County with nearby schools including Henry Raab Elementary School, Central Jr High School, and Governor French Academy.
Ownership History
Date
Name
Owned For
Owner Type
Purchase Details
Closed on
Aug 6, 2019
Sold by
Coburn Christopher J and Coburn John A
Bought by
Johnson Lisa A and Cheeseboro Savasia M
Current Estimated Value
Purchase Details
Closed on
Feb 16, 2006
Sold by
Schwartz Patrick and Schwartz Marjorie
Bought by
Coburn Christopher J and Coburn John A
Home Financials for this Owner
Home Financials are based on the most recent Mortgage that was taken out on this home.
Original Mortgage
$37,930
Interest Rate
8.25%
Mortgage Type
Commercial
Create a Home Valuation Report for This Property
The Home Valuation Report is an in-depth analysis detailing your home's value as well as a comparison with similar homes in the area
Home Values in the Area
Average Home Value in this Area
Purchase History
| Date | Buyer | Sale Price | Title Company |
|---|---|---|---|
| Johnson Lisa A | $40,000 | Town & Country Title Co | |
| Coburn Christopher J | $44,000 | Town & Country Title Co |
Source: Public Records
Mortgage History
| Date | Status | Borrower | Loan Amount |
|---|---|---|---|
| Previous Owner | Coburn Christopher J | $37,930 |
Source: Public Records
Tax History
| Year | Tax Paid | Tax Assessment Tax Assessment Total Assessment is a certain percentage of the fair market value that is determined by local assessors to be the total taxable value of land and additions on the property. | Land | Improvement |
|---|---|---|---|---|
| 2024 | $2,116 | $24,058 | $10,404 | $13,654 |
| 2023 | $2,388 | $25,444 | $10,197 | $15,247 |
| 2022 | $2,192 | $22,906 | $9,180 | $13,726 |
| 2021 | $2,111 | $21,176 | $8,487 | $12,689 |
| 2020 | $2,052 | $20,026 | $8,026 | $12,000 |
| 2019 | $2,186 | $21,096 | $8,441 | $12,655 |
| 2018 | $2,137 | $20,639 | $8,258 | $12,381 |
| 2017 | $1,505 | $20,494 | $8,200 | $12,294 |
| 2016 | $1,481 | $20,059 | $8,026 | $12,033 |
| 2014 | $1,376 | $20,878 | $8,862 | $12,016 |
| 2013 | $1,910 | $21,177 | $8,989 | $12,188 |
Source: Public Records
Map
Nearby Homes
Your Personal Tour Guide
Ask me questions while you tour the home.