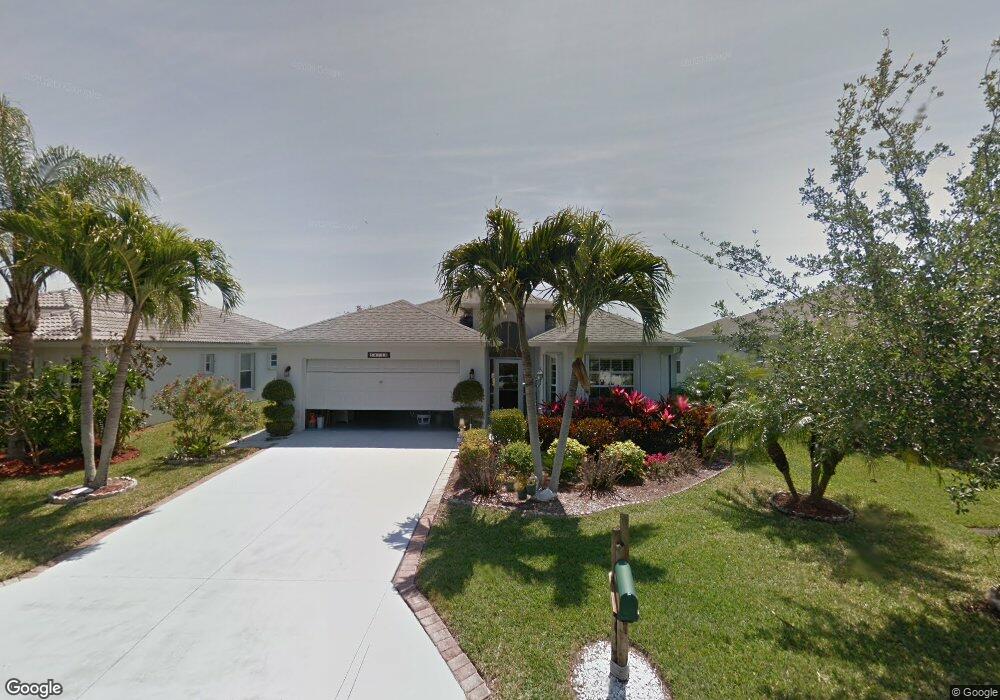
14160 Montauk Ln Fort Myers, FL 33919
Estimated Value: $369,000 - $503,000
2
Beds
2
Baths
2,271
Sq Ft
$190/Sq Ft
Est. Value
About This Home
This home is located at 14160 Montauk Ln, Fort Myers, FL 33919 and is currently estimated at $430,852, approximately $189 per square foot. 14160 Montauk Ln is a home located in Lee County with nearby schools including Orangewood Elementary School, Allen Park Elementary School, and Edison Park Creative & Expressive Arts School.
Ownership History
Date
Name
Owned For
Owner Type
Purchase Details
Closed on
Jul 30, 2025
Sold by
Johnson Ernest and Johnson Lorraine
Bought by
Johnson Ernest and Johnson Lorraine
Current Estimated Value
Purchase Details
Closed on
Mar 8, 2013
Sold by
Knapp Kenneth G and Knapp Roselyn M
Bought by
Johnson Ernest and Johnson Lorraine
Home Financials for this Owner
Home Financials are based on the most recent Mortgage that was taken out on this home.
Original Mortgage
$160,000
Interest Rate
3.56%
Mortgage Type
Unknown
Purchase Details
Closed on
Nov 10, 2011
Sold by
Knapp Roselyn M
Bought by
Knapp Kenneth G and Knapp Roselyn M
Purchase Details
Closed on
Sep 20, 2010
Sold by
Olinder Robert A and Olinder Joan C
Bought by
Knapp Roselyn M and Roselyn M Knapp Trust
Purchase Details
Closed on
May 23, 2003
Sold by
U S Home Corp
Bought by
Olinder Robert A and Olinder Joan C
Create a Home Valuation Report for This Property
The Home Valuation Report is an in-depth analysis detailing your home's value as well as a comparison with similar homes in the area
Home Values in the Area
Average Home Value in this Area
Purchase History
| Date | Buyer | Sale Price | Title Company |
|---|---|---|---|
| Johnson Ernest | -- | None Listed On Document | |
| Johnson Ernest | $200,000 | Sunbelt Title Agency | |
| Knapp Kenneth G | -- | Attorney | |
| Knapp Roselyn M | $249,000 | North America Title Company | |
| Olinder Robert A | $213,400 | -- |
Source: Public Records
Mortgage History
| Date | Status | Borrower | Loan Amount |
|---|---|---|---|
| Previous Owner | Johnson Ernest | $160,000 |
Source: Public Records
Tax History Compared to Growth
Tax History
| Year | Tax Paid | Tax Assessment Tax Assessment Total Assessment is a certain percentage of the fair market value that is determined by local assessors to be the total taxable value of land and additions on the property. | Land | Improvement |
|---|---|---|---|---|
| 2025 | $5,210 | $376,044 | $83,173 | $263,384 |
| 2024 | $5,210 | $405,609 | $79,332 | $291,393 |
| 2023 | $4,691 | $286,932 | $0 | $0 |
| 2022 | $4,297 | $260,847 | $0 | $0 |
| 2021 | $3,588 | $237,134 | $59,000 | $178,134 |
| 2020 | $3,520 | $228,523 | $59,000 | $169,523 |
| 2019 | $3,476 | $223,687 | $59,000 | $164,687 |
| 2018 | $3,601 | $226,904 | $59,000 | $167,904 |
| 2017 | $3,713 | $229,326 | $50,000 | $179,326 |
| 2016 | $3,656 | $224,308 | $50,000 | $174,308 |
| 2015 | $3,489 | $213,696 | $48,000 | $165,696 |
| 2014 | -- | $181,100 | $37,000 | $144,100 |
| 2013 | -- | $196,297 | $40,000 | $156,297 |
Source: Public Records
Map
Nearby Homes
- 14164 Montauk Ln
- 14131 Plum Island Dr
- 14101 Brant Point Cir Unit 3204
- 14091 Brant Point Cir Unit 4201
- 14217 Prim Point Ln
- 14111 Brant Point Cir Unit 2106
- 14111 Brant Point Cir Unit 2103
- 9764 Mendocino Dr
- 14878 Calusa Palms Dr
- 14081 Brant Point Cir Unit 5403
- 14081 Brant Point Cir Unit 5304
- 14195 Mystic Seaport Way
- 14121 Brant Point Cir Unit 1403
- 9836 Los Altos Ct
- 14061 Brant Point Cir Unit 7304
- 14752 Calusa Palms Dr Unit 202
- 14051 Brant Point Cir Unit 8105
- 10091 Lake Cove Dr Unit 301
- 14735 Calusa Palms Dr Unit 102
- 10041 Lake Cove Dr Unit 202
- 14154 Montauk Ln
- 14150 Montauk Ln
- 14163 Montauk Ln
- 14157 Montauk Ln
- 14146 Montauk Ln
- 14149 Montauk Ln
- 14169 Montauk Ln
- 14184 Montauk Ln
- 14175 Montauk Ln
- 14142 Montauk Ln
- 14145 Montauk Ln
- 14181 Montauk Ln
- 14187 Montauk Ln
- 14140 Montauk Ln
- 14139 Montauk Ln
- 9685 Seguin Way
- 9695 Seguin Way
- 14193 Montauk Ln
- 14138 Montauk Ln
- 9705 Seguin Way