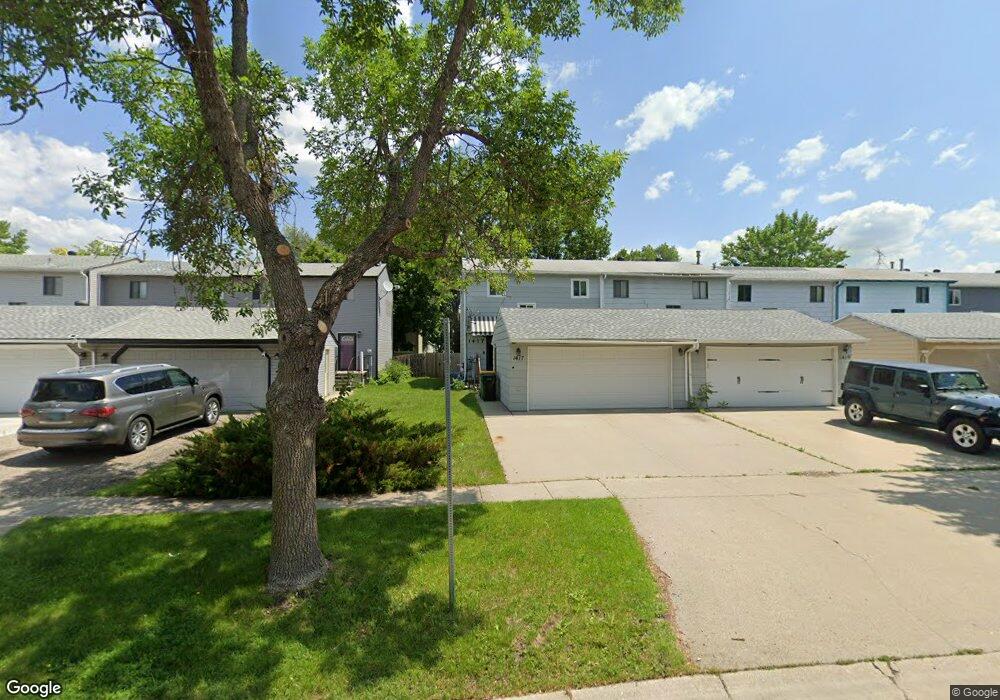
1417 11th St W West Fargo, ND 58078
Sheyenne Park NeighborhoodEstimated Value: $220,767 - $223,000
3
Beds
2
Baths
1,152
Sq Ft
$193/Sq Ft
Est. Value
About This Home
This home is located at 1417 11th St W, West Fargo, ND 58078 and is currently estimated at $221,884, approximately $192 per square foot. 1417 11th St W is a home located in Cass County with nearby schools including Westside Elementary School, Cheney Middle School, and West Fargo High School.
Ownership History
Date
Name
Owned For
Owner Type
Purchase Details
Closed on
Jun 12, 2012
Sold by
Glasser Raymond J and Glasser Susan M
Bought by
Evanson Rory J and Evanson Debra K
Current Estimated Value
Home Financials for this Owner
Home Financials are based on the most recent Mortgage that was taken out on this home.
Original Mortgage
$99,435
Outstanding Balance
$69,778
Interest Rate
4.1%
Mortgage Type
FHA
Estimated Equity
$152,106
Purchase Details
Closed on
Dec 29, 2011
Sold by
Us Bank Na
Bought by
Glasser Taymond J and Glasser Susan M
Home Financials for this Owner
Home Financials are based on the most recent Mortgage that was taken out on this home.
Original Mortgage
$60,000
Interest Rate
3.98%
Mortgage Type
Future Advance Clause Open End Mortgage
Purchase Details
Closed on
Sep 28, 2011
Sold by
Lane Harvy and Johnson Timothy L
Bought by
Us Bank National Assn
Create a Home Valuation Report for This Property
The Home Valuation Report is an in-depth analysis detailing your home's value as well as a comparison with similar homes in the area
Home Values in the Area
Average Home Value in this Area
Purchase History
| Date | Buyer | Sale Price | Title Company |
|---|---|---|---|
| Evanson Rory J | $101,270 | Fm Title | |
| Glasser Taymond J | $57,000 | None Available | |
| Us Bank National Assn | $86,320 | None Available |
Source: Public Records
Mortgage History
| Date | Status | Borrower | Loan Amount |
|---|---|---|---|
| Open | Evanson Rory J | $99,435 | |
| Previous Owner | Glasser Taymond J | $60,000 |
Source: Public Records
Tax History Compared to Growth
Tax History
| Year | Tax Paid | Tax Assessment Tax Assessment Total Assessment is a certain percentage of the fair market value that is determined by local assessors to be the total taxable value of land and additions on the property. | Land | Improvement |
|---|---|---|---|---|
| 2024 | $2,697 | $86,950 | $13,000 | $73,950 |
| 2023 | $2,617 | $83,750 | $13,000 | $70,750 |
| 2022 | $2,596 | $79,950 | $13,000 | $66,950 |
| 2021 | $2,475 | $71,550 | $9,250 | $62,300 |
| 2020 | $2,396 | $72,000 | $9,250 | $62,750 |
| 2019 | $2,190 | $69,200 | $9,250 | $59,950 |
| 2018 | $2,036 | $66,400 | $9,250 | $57,150 |
| 2017 | $1,974 | $66,450 | $9,250 | $57,200 |
| 2016 | $1,776 | $65,050 | $9,250 | $55,800 |
| 2015 | $1,691 | $56,350 | $4,300 | $52,050 |
| 2014 | $1,664 | $52,650 | $4,300 | $48,350 |
| 2013 | $1,541 | $51,700 | $4,300 | $47,400 |
Source: Public Records
Map
Nearby Homes
- 830 12th Ave W
- 1447 Elmwood Ct
- 723 16th Ave W
- 1165 7th Ave W
- 744 Elm St
- 1179 Highland Ln W
- 232 15th Ave W
- 1234 Highland Ln W
- 2054 12th St W
- 719 5th Ave W
- 1633 3rd St W
- 1029 Highland Ln W
- 514 7th Ave W
- 226 10 1/2 Ave W
- 520 6th Ave W Unit 8
- 1043 Barnes Dr W
- 1264 Marlys Dr W
- 2101 10th St W
- 1844 1st St
- 2124 14th St W