1417 Horseshoe Bend High Ridge, MO 63049
Estimated Value: $225,000 - $253,000
--
Bed
--
Bath
1,200
Sq Ft
$201/Sq Ft
Est. Value
About This Home
This home is located at 1417 Horseshoe Bend, High Ridge, MO 63049 and is currently estimated at $241,495, approximately $201 per square foot. 1417 Horseshoe Bend is a home located in Jefferson County with nearby schools including Northwest High School.
Ownership History
Date
Name
Owned For
Owner Type
Purchase Details
Closed on
Aug 22, 2022
Sold by
Jane Uxa Baalmann Revocable Living Trust
Bought by
Brown Sarah Jane
Current Estimated Value
Purchase Details
Closed on
Oct 31, 2007
Sold by
Hanneman Christina M and Hanneman Kenin
Bought by
Inabnit Kenneth M
Home Financials for this Owner
Home Financials are based on the most recent Mortgage that was taken out on this home.
Original Mortgage
$162,000
Interest Rate
6.42%
Mortgage Type
Purchase Money Mortgage
Purchase Details
Closed on
Dec 20, 2001
Sold by
Gray Jeffrey S
Bought by
Gray Christina M
Purchase Details
Closed on
Jun 30, 1999
Sold by
Johnson Otis L and Johnson Lori
Bought by
Gray Jeffrey S and Gray Christina M
Home Financials for this Owner
Home Financials are based on the most recent Mortgage that was taken out on this home.
Original Mortgage
$108,794
Interest Rate
7.21%
Mortgage Type
FHA
Create a Home Valuation Report for This Property
The Home Valuation Report is an in-depth analysis detailing your home's value as well as a comparison with similar homes in the area
Home Values in the Area
Average Home Value in this Area
Purchase History
| Date | Buyer | Sale Price | Title Company |
|---|---|---|---|
| Brown Sarah Jane | -- | Title Partners | |
| Inabnit Kenneth M | -- | Ust | |
| Gray Christina M | -- | -- | |
| Gray Jeffrey S | -- | Commonwealth Title |
Source: Public Records
Mortgage History
| Date | Status | Borrower | Loan Amount |
|---|---|---|---|
| Previous Owner | Inabnit Kenneth M | $162,000 | |
| Previous Owner | Gray Jeffrey S | $108,794 |
Source: Public Records
Tax History Compared to Growth
Tax History
| Year | Tax Paid | Tax Assessment Tax Assessment Total Assessment is a certain percentage of the fair market value that is determined by local assessors to be the total taxable value of land and additions on the property. | Land | Improvement |
|---|---|---|---|---|
| 2025 | $1,675 | $24,800 | $4,800 | $20,000 |
| 2024 | $1,675 | $23,200 | $4,800 | $18,400 |
| 2023 | $1,675 | $23,200 | $4,800 | $18,400 |
| 2022 | $1,668 | $23,200 | $4,800 | $18,400 |
| 2021 | $1,657 | $23,200 | $4,800 | $18,400 |
| 2020 | $1,500 | $20,500 | $4,200 | $16,300 |
| 2019 | $1,498 | $20,500 | $4,200 | $16,300 |
| 2018 | $1,518 | $20,500 | $4,200 | $16,300 |
| 2017 | $1,387 | $20,500 | $4,200 | $16,300 |
| 2016 | $1,304 | $19,100 | $4,000 | $15,100 |
| 2015 | $1,340 | $19,100 | $4,000 | $15,100 |
| 2013 | -- | $19,100 | $4,000 | $15,100 |
Source: Public Records
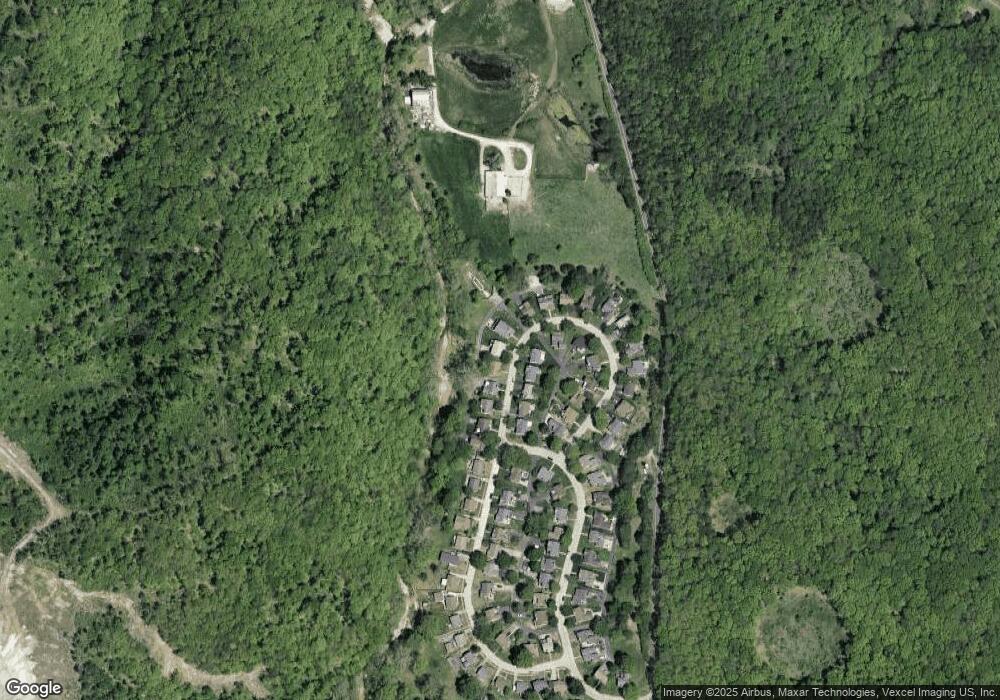
Map
Nearby Homes
- 1516 Redbriar Dr
- 907 Palomino Path
- 2300 Appaloosa Trail
- 60 the Bluffs Dr Unit 60
- 59 the Bluffs Dr Unit 59
- 54 the Bluffs Dr Unit 54
- 709 Heatherstone Dr
- 2135 Linnus Dr
- 2149 Linnus Dr
- 0 3 Lot Blk 2 High Ridge Manor Unit MAR24044893
- 2460 Huntress Hill Ln
- 2132 Ridgedale Dr
- 5012 Oak Bluff Dr
- 1524 Shalimar Ridge Ln
- 2436 Hillsboro Valley Park Rd
- 152 Brandy Mill Cir Unit 9G
- 168 Brandy Mill Cir Unit 5B
- 0 Mikel Ln
- 1201 Diamond Valley Dr
- 2715 Royal Oak Dr
- 1413 Horseshoe Bend
- 1421 Horseshoe Bend
- 1425 Horseshoe Bend
- 1414 Horseshoe Bend
- 1409 Horseshoe Bend
- 1420 Horseshoe Bend
- 1424 Horseshoe Bend
- 1429 Horseshoe Bend
- 1404 Horseshoe Bend
- 1405 Horseshoe Bend
- 1428 Horseshoe Bend
- 1433 Horseshoe Bend
- 1432 Horseshoe Bend
- 1401 Horseshoe Bend
- 1394 Horseshoe Bend
- 1366 Horseshoe Bend
- 1370 Horseshoe Bend
- 1384 Horseshoe Bend
- 1437 Creekside Dr
- 1376 Horseshoe Bend