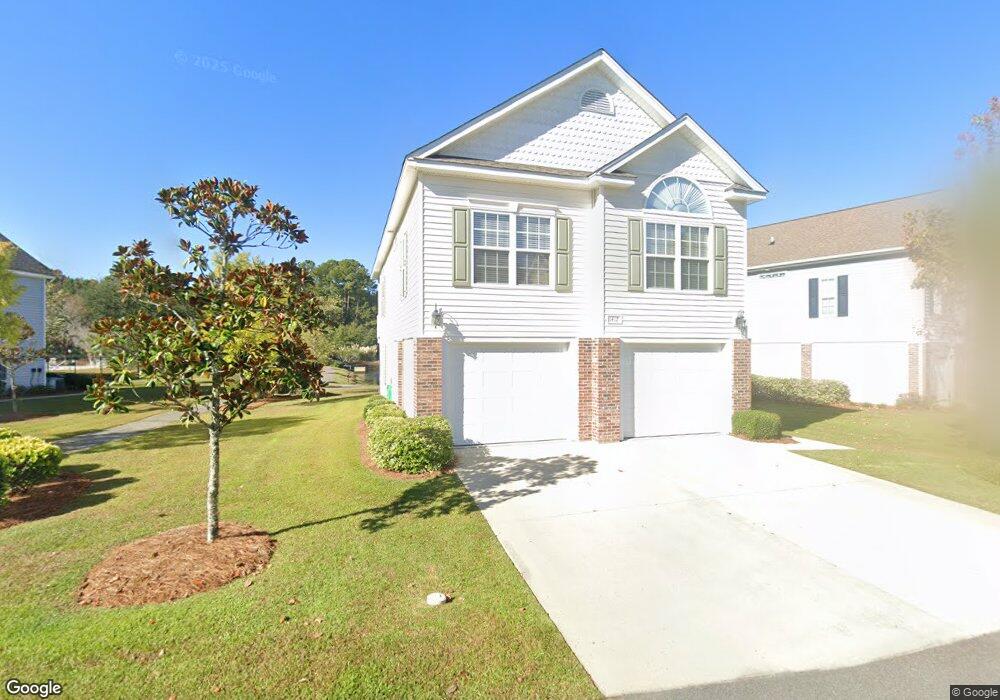
1417 Powhaton Dr Unit Cottages on Farrow P Myrtle Beach, SC 29577
Market Commons NeighborhoodEstimated Value: $424,000 - $436,000
4
Beds
3
Baths
2,205
Sq Ft
$195/Sq Ft
Est. Value
About This Home
This home is located at 1417 Powhaton Dr Unit Cottages on Farrow P, Myrtle Beach, SC 29577 and is currently estimated at $429,074, approximately $194 per square foot. 1417 Powhaton Dr Unit Cottages on Farrow P is a home located in Horry County with nearby schools including Myrtle Beach Child Development Center, Myrtle Beach Primary School, and Myrtle Beach Elementary School.
Ownership History
Date
Name
Owned For
Owner Type
Purchase Details
Closed on
Aug 25, 2015
Sold by
Duclos Daniel and Duclos Louise
Bought by
Magyar John A and Magyar Karla J
Current Estimated Value
Home Financials for this Owner
Home Financials are based on the most recent Mortgage that was taken out on this home.
Original Mortgage
$150,000
Outstanding Balance
$118,256
Interest Rate
4.02%
Estimated Equity
$310,818
Purchase Details
Closed on
Nov 30, 2010
Sold by
Honeycutt Russell M
Bought by
Duclos Daniel
Purchase Details
Closed on
Feb 20, 2008
Sold by
Springfield Development Group Llc
Bought by
Honeycutt Russell M and Honeycutt Kimberly D
Home Financials for this Owner
Home Financials are based on the most recent Mortgage that was taken out on this home.
Original Mortgage
$200,000
Interest Rate
5.46%
Mortgage Type
Unknown
Create a Home Valuation Report for This Property
The Home Valuation Report is an in-depth analysis detailing your home's value as well as a comparison with similar homes in the area
Home Values in the Area
Average Home Value in this Area
Purchase History
| Date | Buyer | Sale Price | Title Company |
|---|---|---|---|
| Magyar John A | $230,000 | -- | |
| Duclos Daniel | $212,450 | -- | |
| Honeycutt Russell M | $315,335 | None Available |
Source: Public Records
Mortgage History
| Date | Status | Borrower | Loan Amount |
|---|---|---|---|
| Open | Magyar John A | $150,000 | |
| Previous Owner | Honeycutt Russell M | $200,000 |
Source: Public Records
Tax History Compared to Growth
Tax History
| Year | Tax Paid | Tax Assessment Tax Assessment Total Assessment is a certain percentage of the fair market value that is determined by local assessors to be the total taxable value of land and additions on the property. | Land | Improvement |
|---|---|---|---|---|
| 2024 | $759 | $14,996 | $0 | $14,996 |
| 2023 | $759 | $9,136 | $0 | $9,136 |
| 2021 | $658 | $9,136 | $0 | $9,136 |
| 2020 | $569 | $9,136 | $0 | $9,136 |
| 2019 | $547 | $9,136 | $0 | $9,136 |
| 2018 | $519 | $8,600 | $0 | $8,600 |
| 2017 | $504 | $8,600 | $0 | $8,600 |
| 2016 | -- | $8,600 | $0 | $8,600 |
| 2015 | $2,920 | $11,232 | $0 | $11,232 |
| 2014 | $2,839 | $11,232 | $0 | $11,232 |
Source: Public Records
Map
Nearby Homes
- 1407 Powhaton Dr
- 1411 Powhaton Dr Unit 53
- 1415 Powhaton Dr Unit 56
- 1367 Cottage Dr Unit 1367 Cottage Drive
- 1423 Powhaton Dr Unit 69
- 1426 Powhaton Dr Unit 70
- 1450 Powhaton Dr Unit 87
- 1572 Thornbury Dr
- 1777 Bluff Dr
- 1823 Francis Ct
- TBD Farrow Pkwy Unit At Market Common
- 821 Rebecca Ln Unit 6C
- 821 Rebecca Ln Unit 6B
- 821 Rebecca Ln Unit 6A
- 821 Rebecca Ln Unit 6D
- 780 Maxine Ct Unit 8E
- 780 Maxine Ct Unit 8C
- 780 Maxine Ct Unit 8A
- 780 Maxine Ct Unit 8B
- 780 Maxine Ct Unit 8D
- 1417 Powhaton Dr Unit 59
- 1419 Powhaton Dr Unit 60
- 1389 Wycliffe Dr Unit To Be Built
- 1389 Wycliffe Dr
- 1413 Powhaton Dr
- 1416 Powhaton Dr Unit 58
- 1414 Powhaton Dr Unit St. John
- 1387 Wycliffe Dr
- 1429 Powhaton Dr Unit 73
- 1411 Powhaton Dr Unit Cottages on Farrow P
- 1435 Powhaton Dr Unit 77
- 1412 Powhaton Dr Unit St. John
- 1385 Wycliffe Dr Unit Cottages on Farrow P
- 1385 Wycliffe Dr Unit 63
- 1437 Powhaton Dr
- 1410 Powhaton Dr Unit St. John
- 1409 Powhaton Dr
- 1392 Wycliffe Dr Unit St. John
- 1392 Wycliffe Dr Unit 67
- 1424 Powhaton Dr Unit St. John