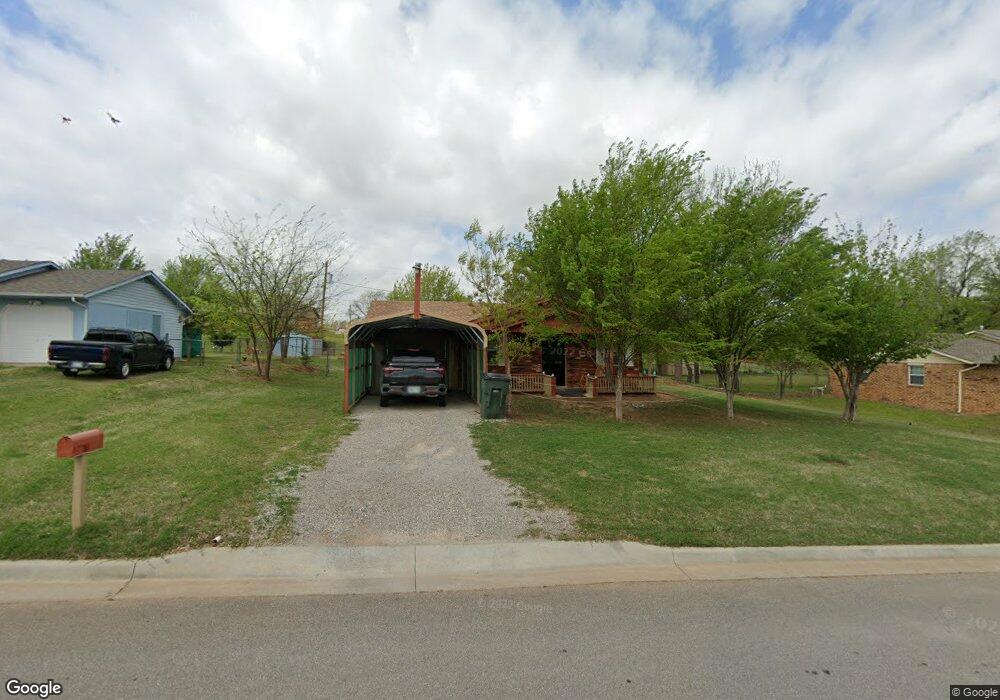
1417 S East Ave Pauls Valley, OK 73075
Estimated Value: $117,626 - $149,000
3
Beds
2
Baths
1,200
Sq Ft
$112/Sq Ft
Est. Value
About This Home
This home is located at 1417 S East Ave, Pauls Valley, OK 73075 and is currently estimated at $134,157, approximately $111 per square foot. 1417 S East Ave is a home located in Garvin County with nearby schools including Pauls Valley Elementary School, Jackson Elementary School, and Pauls Valley Intermediate School.
Ownership History
Date
Name
Owned For
Owner Type
Purchase Details
Closed on
Dec 7, 2023
Sold by
Wynn Sheery and Wynn Ronald
Bought by
Wynn Ronald
Current Estimated Value
Purchase Details
Closed on
Jun 10, 2021
Sold by
Wynn Sheryl Kay
Bought by
Wynn Ronald Gene
Purchase Details
Closed on
Aug 30, 2013
Sold by
Oklahoma Heritage Bank
Bought by
Wynn Ronald and Wynn Sheryl
Home Financials for this Owner
Home Financials are based on the most recent Mortgage that was taken out on this home.
Original Mortgage
$61,985
Interest Rate
4.42%
Mortgage Type
Future Advance Clause Open End Mortgage
Purchase Details
Closed on
Jun 28, 2012
Sold by
Knighten Dixie and Knighten Winfred L
Bought by
Oklahoma Heritage Bank
Create a Home Valuation Report for This Property
The Home Valuation Report is an in-depth analysis detailing your home's value as well as a comparison with similar homes in the area
Home Values in the Area
Average Home Value in this Area
Purchase History
| Date | Buyer | Sale Price | Title Company |
|---|---|---|---|
| Wynn Ronald | -- | None Listed On Document | |
| Wynn Ronald Gene | -- | None Available | |
| Wynn Ronald | $22,500 | None Available | |
| Oklahoma Heritage Bank | $107 | None Available |
Source: Public Records
Mortgage History
| Date | Status | Borrower | Loan Amount |
|---|---|---|---|
| Previous Owner | Wynn Ronald G | $102,000 | |
| Previous Owner | Wynn Ronald | $70,300 | |
| Previous Owner | Wynn Ronald | $61,985 | |
| Previous Owner | Knighten Dixie | $53,981 | |
| Previous Owner | Knighten Dixie E | $54,085 | |
| Previous Owner | Knighten Dixie | $33,299 |
Source: Public Records
Tax History Compared to Growth
Tax History
| Year | Tax Paid | Tax Assessment Tax Assessment Total Assessment is a certain percentage of the fair market value that is determined by local assessors to be the total taxable value of land and additions on the property. | Land | Improvement |
|---|---|---|---|---|
| 2024 | -- | $4,899 | $132 | $4,767 |
| 2023 | $0 | $4,756 | $132 | $4,624 |
| 2022 | $0 | $4,617 | $132 | $4,485 |
| 2021 | $0 | $4,483 | $518 | $3,965 |
| 2020 | $0 | $4,352 | $501 | $3,851 |
| 2019 | $437 | $4,225 | $485 | $3,740 |
| 2018 | $0 | $4,024 | $449 | $3,575 |
| 2017 | $0 | $3,907 | $421 | $3,486 |
| 2016 | $241 | $3,794 | $399 | $3,395 |
| 2015 | $235 | $3,683 | $391 | $3,292 |
| 2014 | $226 | $3,576 | $546 | $3,030 |
Source: Public Records
Map
Nearby Homes
- 425 Mohawk Dr
- 1006 S Chickasaw St
- 220 Memory Ln
- 14861 Us Highway 77
- 220 S Edith Ave
- 102 Twin Oaks
- 202 W Lee St
- 221 Terrace Dr
- 300 Terrace Dr
- 311 S Bertha Ave
- 107 E Grimmett Dr
- 107 Highland Rd
- 1705 S Walnut St
- 405 S Catherine St
- 421 S Catherine St
- 207 S Mcclure Ave
- 201 S Oak St
- 801 W Leslie St
- 213 S Elm St
- 607 S Paul Ave
- 1421 S East Ave
- 1413 S East Ave
- 1405 S East Ave
- 422 S Elizabeth Ave
- 414 S Elizabeth Ave
- 1425 S East Ave
- 1409 S East Ave
- 1426 S East Ave
- 1422 S East Ave
- 1430 S East Ave
- 1418 S East Ave
- 410 S Elizabeth Ave
- 418 S Elizabeth Ave
- 426 S Elizabeth Ave
- 0 S Elizabeth Ave
- 1434 S East Ave
- 1414 S East Ave
- 1410 S East Ave
- 1438 S East Ave
- 1503 S East Ave