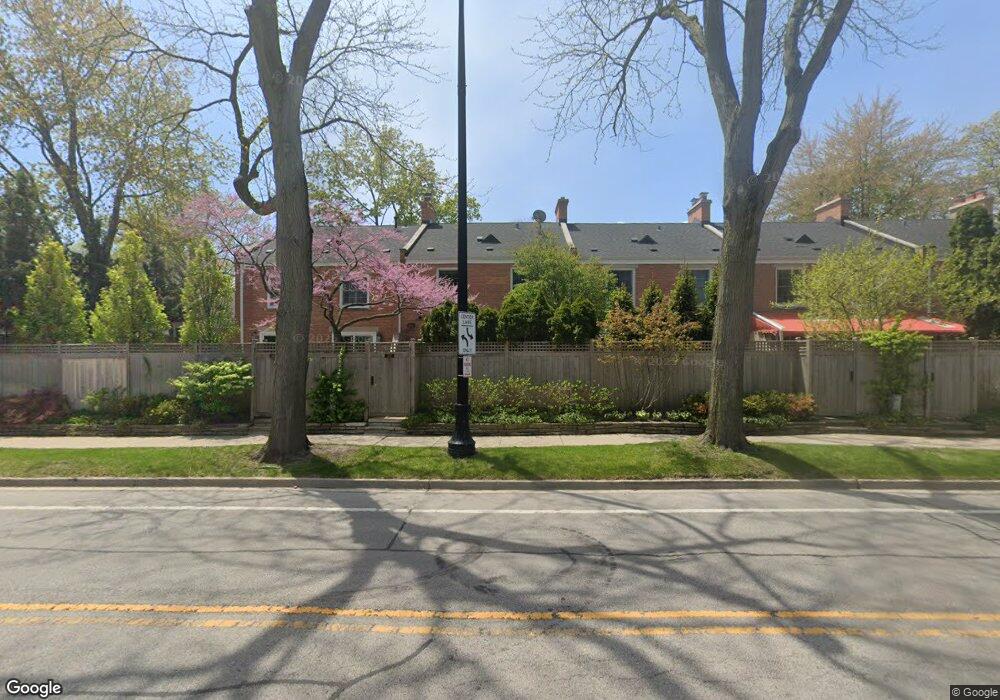
1417 Sheridan Rd Unit 7E Wilmette, IL 60091
Estimated Value: $972,000 - $1,212,102
3
Beds
4
Baths
1,862
Sq Ft
$602/Sq Ft
Est. Value
About This Home
This home is located at 1417 Sheridan Rd Unit 7E, Wilmette, IL 60091 and is currently estimated at $1,120,026, approximately $601 per square foot. 1417 Sheridan Rd Unit 7E is a home located in Cook County with nearby schools including Central Elementary School, Highcrest Middle School, and Wilmette Junior High School.
Ownership History
Date
Name
Owned For
Owner Type
Purchase Details
Closed on
Nov 14, 2019
Sold by
Gries Sharon S
Bought by
Coney Jeffrey P and Jeffrey P Coney Trust
Current Estimated Value
Purchase Details
Closed on
Jul 6, 2017
Sold by
Gries Gary and Gries Sharon
Bought by
Gries Sharon S and Sharon S Gries Living Trust
Purchase Details
Closed on
Aug 30, 2012
Sold by
Weber Debra K
Bought by
Gries Gary and Gries Sharon
Purchase Details
Closed on
Jan 13, 2010
Sold by
Weber Joan A
Bought by
Weber Debra K
Home Financials for this Owner
Home Financials are based on the most recent Mortgage that was taken out on this home.
Original Mortgage
$417,000
Interest Rate
5.11%
Mortgage Type
New Conventional
Purchase Details
Closed on
Jun 4, 1996
Sold by
Weber Clarence H and Weber Joan A
Bought by
Weber Joan A
Create a Home Valuation Report for This Property
The Home Valuation Report is an in-depth analysis detailing your home's value as well as a comparison with similar homes in the area
Home Values in the Area
Average Home Value in this Area
Purchase History
| Date | Buyer | Sale Price | Title Company |
|---|---|---|---|
| Coney Jeffrey P | $772,500 | Precision Title | |
| Gries Sharon S | -- | None Available | |
| Gries Gary | $904,500 | None Available | |
| Weber Debra K | $545,000 | Cti | |
| Weber Joan A | -- | -- |
Source: Public Records
Mortgage History
| Date | Status | Borrower | Loan Amount |
|---|---|---|---|
| Previous Owner | Weber Debra K | $417,000 |
Source: Public Records
Tax History Compared to Growth
Tax History
| Year | Tax Paid | Tax Assessment Tax Assessment Total Assessment is a certain percentage of the fair market value that is determined by local assessors to be the total taxable value of land and additions on the property. | Land | Improvement |
|---|---|---|---|---|
| 2024 | $18,504 | $87,515 | $13,500 | $74,015 |
| 2023 | $19,081 | $87,515 | $13,500 | $74,015 |
| 2022 | $19,081 | $95,000 | $13,500 | $81,500 |
| 2021 | $16,491 | $69,471 | $4,862 | $64,609 |
| 2020 | $17,753 | $69,471 | $4,862 | $64,609 |
| 2019 | $15,818 | $75,512 | $4,862 | $70,650 |
| 2018 | $11,746 | $55,554 | $4,052 | $51,502 |
| 2017 | $11,446 | $55,554 | $4,052 | $51,502 |
| 2016 | $12,075 | $55,554 | $4,052 | $51,502 |
| 2015 | $11,068 | $49,079 | $3,342 | $45,737 |
| 2014 | $11,990 | $49,079 | $3,342 | $45,737 |
| 2013 | $11,450 | $49,079 | $3,342 | $45,737 |
Source: Public Records
Map
Nearby Homes
- 830 Chestnut Ave
- 819 Chestnut Ave
- 1500 Sheridan Rd Unit 4A
- 1616 Sheridan Rd Unit 9H
- 1616 Sheridan Rd Unit 2E
- 1630 Sheridan Rd Unit 2N
- 1630 Sheridan Rd Unit 3C
- 1630 Sheridan Rd Unit 4M
- 1630 Sheridan Rd Unit 8K
- 1630 Sheridan Rd Unit 2F
- 1630 Sheridan Rd Unit 2J
- 1630 Sheridan Rd Unit 5K
- 1120 Chestnut Ave
- 714 Forest Ave
- 831 Forest Ave
- 623 Forest Ave
- 219 Sheridan Rd
- 1118 Forest Ave
- 706 Washington Ave
- 321 Leicester Rd
- 1417 Sheridan Rd
- 1415 Sheridan Rd
- 1419 Sheridan Rd
- 1421 Sheridan Rd
- 1425 Sheridan Rd Unit 7A
- 1429 Sheridan Rd
- 1431 Sheridan Rd
- 1427 Sheridan Rd
- 1433 Sheridan Rd
- 1403 Sheridan Rd
- 1435 Sheridan Rd
- 1437 Sheridan Rd
- 806 Chestnut Ave
- 1401 Sheridan Rd
- 804 Chestnut Ave
- 808 Chestnut Ave
- 809 Westerfield Dr
- 730 Chestnut Ave
- 818 Chestnut Ave
- 811 Westerfield Dr