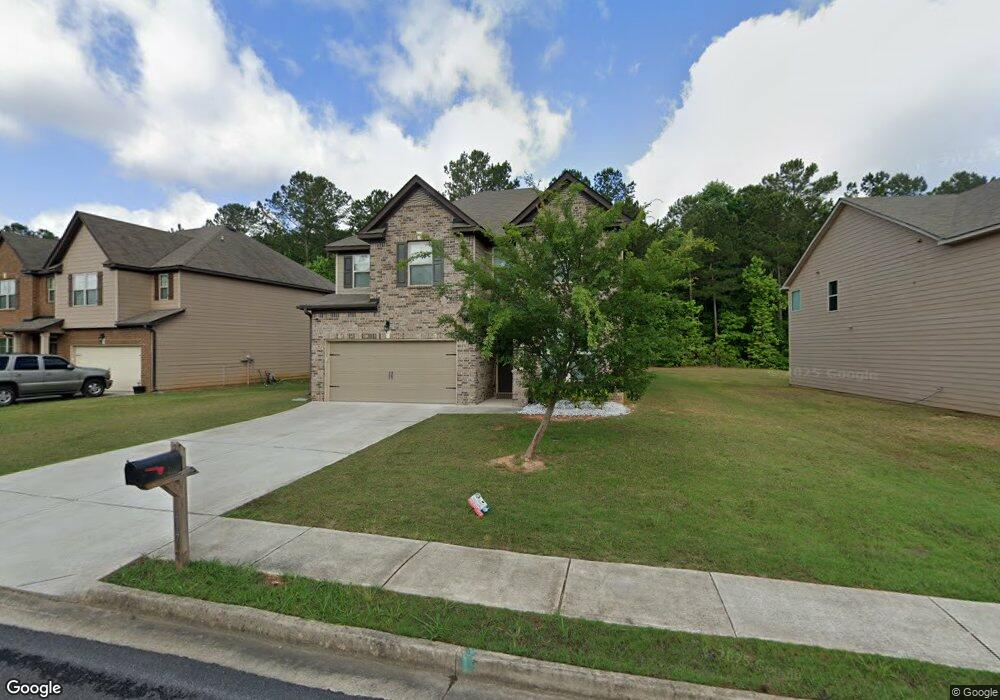
1417 Stone Ridge Ct Unit 164 Hampton, GA 30228
Estimated Value: $341,000 - $347,000
4
Beds
3
Baths
2,379
Sq Ft
$145/Sq Ft
Est. Value
About This Home
This home is located at 1417 Stone Ridge Ct Unit 164, Hampton, GA 30228 and is currently estimated at $344,794, approximately $144 per square foot. 1417 Stone Ridge Ct Unit 164 is a home located in Henry County with nearby schools including Rocky Creek Elementary School, Hampton Middle School, and Hampton High School.
Ownership History
Date
Name
Owned For
Owner Type
Purchase Details
Closed on
Jun 2, 2022
Sold by
Weber Jessica
Bought by
Pearson Broderick and Weber Jessica
Current Estimated Value
Home Financials for this Owner
Home Financials are based on the most recent Mortgage that was taken out on this home.
Original Mortgage
$268,620
Outstanding Balance
$253,056
Interest Rate
4.37%
Mortgage Type
FHA
Estimated Equity
$91,738
Purchase Details
Closed on
Sep 1, 2020
Sold by
Haynes Cynthia
Bought by
Weber Jessica
Home Financials for this Owner
Home Financials are based on the most recent Mortgage that was taken out on this home.
Original Mortgage
$220,924
Interest Rate
2.8%
Mortgage Type
FHA
Purchase Details
Closed on
Mar 24, 2017
Sold by
D R Horton Wph Llc
Bought by
Haynes Cynthia
Home Financials for this Owner
Home Financials are based on the most recent Mortgage that was taken out on this home.
Original Mortgage
$194,797
Interest Rate
4.16%
Mortgage Type
New Conventional
Create a Home Valuation Report for This Property
The Home Valuation Report is an in-depth analysis detailing your home's value as well as a comparison with similar homes in the area
Home Values in the Area
Average Home Value in this Area
Purchase History
| Date | Buyer | Sale Price | Title Company |
|---|---|---|---|
| Pearson Broderick | -- | -- | |
| Weber Jessica | $225,000 | -- | |
| Haynes Cynthia | $192,850 | -- |
Source: Public Records
Mortgage History
| Date | Status | Borrower | Loan Amount |
|---|---|---|---|
| Open | Pearson Broderick | $268,620 | |
| Previous Owner | Weber Jessica | $220,924 | |
| Previous Owner | Haynes Cynthia | $194,797 |
Source: Public Records
Tax History Compared to Growth
Tax History
| Year | Tax Paid | Tax Assessment Tax Assessment Total Assessment is a certain percentage of the fair market value that is determined by local assessors to be the total taxable value of land and additions on the property. | Land | Improvement |
|---|---|---|---|---|
| 2025 | $5,464 | $140,120 | $14,000 | $126,120 |
| 2024 | $5,464 | $143,920 | $14,000 | $129,920 |
| 2023 | $5,788 | $145,040 | $18,000 | $127,040 |
| 2022 | $4,170 | $118,520 | $12,000 | $106,520 |
| 2021 | $2,968 | $90,000 | $11,970 | $78,030 |
| 2020 | $2,729 | $85,840 | $12,000 | $73,840 |
| 2019 | $2,763 | $85,760 | $10,000 | $75,760 |
| 2018 | $2,486 | $74,680 | $10,000 | $64,680 |
| 2016 | $182 | $5,000 | $5,000 | $0 |
| 2015 | $227 | $6,000 | $6,000 | $0 |
| 2014 | $81 | $2,120 | $2,120 | $0 |
Source: Public Records
Map
Nearby Homes
- 1417 Stone Ridge Ct
- 1419 Stone Ridge Ct
- 264 Millstone Dr
- 303 Millstone Dr
- 354 Cobblestone Ct
- 211 Millstone Dr
- 363 Cobblestone Ct
- 93 Floyd Ln
- 0 Hampton Locust Grove Rd Unit 10541409
- 165 Lake Hampton Dr
- 50 Laralee Ln
- 189 Lake Hampton Dr
- 124 Madisyn Dr
- Hayden Plan at Glenmaye
- Ashley 24 Plan at Glenmaye
- Ashley 22 Plan at Glenmaye
- Ashley Plan at Glenmaye
- Somerset Plan at Glenmaye
- Dennis Plan at Glenmaye
- Celia Plan at Glenmaye
- 1415 Stone Ridge Ct Unit 165
- 1419 Stone Ridge Ct Unit 163
- 1413 Stone Ridge Ct Unit 166
- 1413 Stone Ridge Ct
- 1421 Stone Ridge Ct Unit 259
- 1421 Stone Ridge Ct
- 1411 Stone Ridge Ct
- 1411 Stone Ridge Ct Unit 167
- 1423 Stone Ridge Ct Unit 161
- 1423 Stone Ridge Ct
- 0 Stone Ridge Ct Unit 8631451
- 0 Stone Ridge Ct Unit 8631319
- 0 Stone Ridge Ct Unit 8300566
- 0 Stone Ridge Ct Unit 8391481
- 0 Stone Ridge Ct Unit 9017756
- 0 Stone Ridge Ct Unit 8922233
- 0 Stone Ridge Ct Unit 7422937
- 0 Stone Ridge Ct Unit 7428347
- 0 Stone Ridge Ct Unit 7428289
- 0 Stone Ridge Ct Unit 7497478