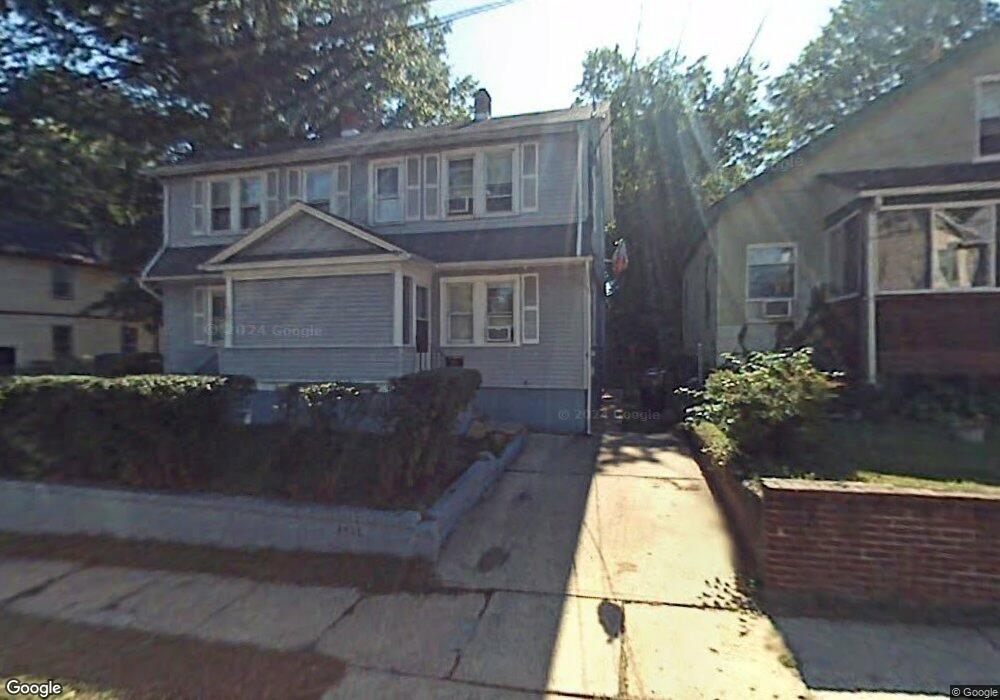
1417 Willever St Unit 21 Plainfield, NJ 07063
Estimated Value: $486,000 - $536,000
2
Beds
2
Baths
2,016
Sq Ft
$253/Sq Ft
Est. Value
About This Home
This home is located at 1417 Willever St Unit 21, Plainfield, NJ 07063 and is currently estimated at $509,725, approximately $252 per square foot. 1417 Willever St Unit 21 is a home located in Union County with nearby schools including Jefferson Elementary School, Hubbard Middle School, and Plainfield High School.
Ownership History
Date
Name
Owned For
Owner Type
Purchase Details
Closed on
Feb 17, 2022
Sold by
Asiegbulem Chinwe H
Bought by
Asiegbulem Chinwe H and Asiegbulem Ngozi
Current Estimated Value
Home Financials for this Owner
Home Financials are based on the most recent Mortgage that was taken out on this home.
Original Mortgage
$250,035
Outstanding Balance
$232,176
Interest Rate
3.55%
Mortgage Type
FHA
Estimated Equity
$277,549
Purchase Details
Closed on
Feb 1, 2019
Sold by
Simpson Marvan P and Simpson Gaye
Bought by
Asiegbulem Chinwe H
Home Financials for this Owner
Home Financials are based on the most recent Mortgage that was taken out on this home.
Original Mortgage
$255,290
Interest Rate
4.4%
Mortgage Type
FHA
Purchase Details
Closed on
Aug 17, 2005
Sold by
Testman Susie
Bought by
Simpson Marvan P and Simpson Gaye
Home Financials for this Owner
Home Financials are based on the most recent Mortgage that was taken out on this home.
Original Mortgage
$228,000
Interest Rate
5.66%
Purchase Details
Closed on
Feb 6, 1995
Sold by
Holland David and Holland Shi Lee
Bought by
Testman Susie
Create a Home Valuation Report for This Property
The Home Valuation Report is an in-depth analysis detailing your home's value as well as a comparison with similar homes in the area
Home Values in the Area
Average Home Value in this Area
Purchase History
| Date | Buyer | Sale Price | Title Company |
|---|---|---|---|
| Asiegbulem Chinwe H | -- | None Listed On Document | |
| Asiegbulem Chinwe H | -- | None Listed On Document | |
| Asiegbulem Chinwe H | $260,000 | None Available | |
| Simpson Marvan P | $285,000 | -- | |
| Testman Susie | $112,000 | -- |
Source: Public Records
Mortgage History
| Date | Status | Borrower | Loan Amount |
|---|---|---|---|
| Open | Asiegbulem Chinwe H | $250,035 | |
| Closed | Asiegbulem Chinwe H | $250,035 | |
| Previous Owner | Asiegbulem Chinwe H | $255,290 | |
| Previous Owner | Simpson Marvan P | $228,000 |
Source: Public Records
Tax History Compared to Growth
Tax History
| Year | Tax Paid | Tax Assessment Tax Assessment Total Assessment is a certain percentage of the fair market value that is determined by local assessors to be the total taxable value of land and additions on the property. | Land | Improvement |
|---|---|---|---|---|
| 2025 | $8,164 | $93,500 | $34,100 | $59,400 |
| 2024 | $8,084 | $93,500 | $34,100 | $59,400 |
| 2023 | $8,084 | $93,500 | $34,100 | $59,400 |
| 2022 | $7,909 | $93,500 | $34,100 | $59,400 |
| 2021 | $7,840 | $93,500 | $34,100 | $59,400 |
| 2020 | $7,818 | $93,500 | $34,100 | $59,400 |
| 2019 | $7,818 | $93,500 | $34,100 | $59,400 |
| 2018 | $7,654 | $93,500 | $34,100 | $59,400 |
| 2017 | $7,467 | $93,500 | $34,100 | $59,400 |
| 2016 | $7,315 | $93,500 | $34,100 | $59,400 |
| 2015 | $7,099 | $93,500 | $34,100 | $59,400 |
| 2014 | $6,906 | $93,500 | $34,100 | $59,400 |
Source: Public Records
Map
Nearby Homes
- 1357-1403 S 2nd St Unit 2
- 30 Everett Place
- 1222 W 3rd St Unit 24
- 405 Wall St
- 1411 Myrtle Ave
- 1405 Myrtle Ave Unit 11
- 1405 11myrtle Ave
- 1408 W 5th St
- 1637 S 2nd St
- 1762 S 2nd St
- 40 Emma St Unit 42
- 410 Harvard St
- 318 Halsey St Unit 20
- 324 Rock Ave
- 355 Bergen St
- 73-81 Mariners Ct
- 525 Pleasant Ave
- 304 Chestnut Place
- 639 Parkview Ave
- 20-22 Albert St
- 1417-21 Willever St
- 1423 Willever St Unit 25
- 1415 Willever St
- 1416 W 3rd St Unit 20
- 1427-29 Willever St
- 1427 Willever St Unit 29
- 1412 W 3rd St
- 1422 W 3rd St Unit 24
- 1418 Willever St Unit 24
- 1422-24 W 3rd St
- 1414 W 3rd St
- 1414 Willever St Unit 16
- 1426 W 3rd St
- 1408 W 3rd St Unit 10
- 1426 Willever St
- 1410 Willever St Unit 12
- 1410-12 Willever St
- 1431 Willever St Unit 35
- 1428 Willever St
- 1405 Willever St Unit 9