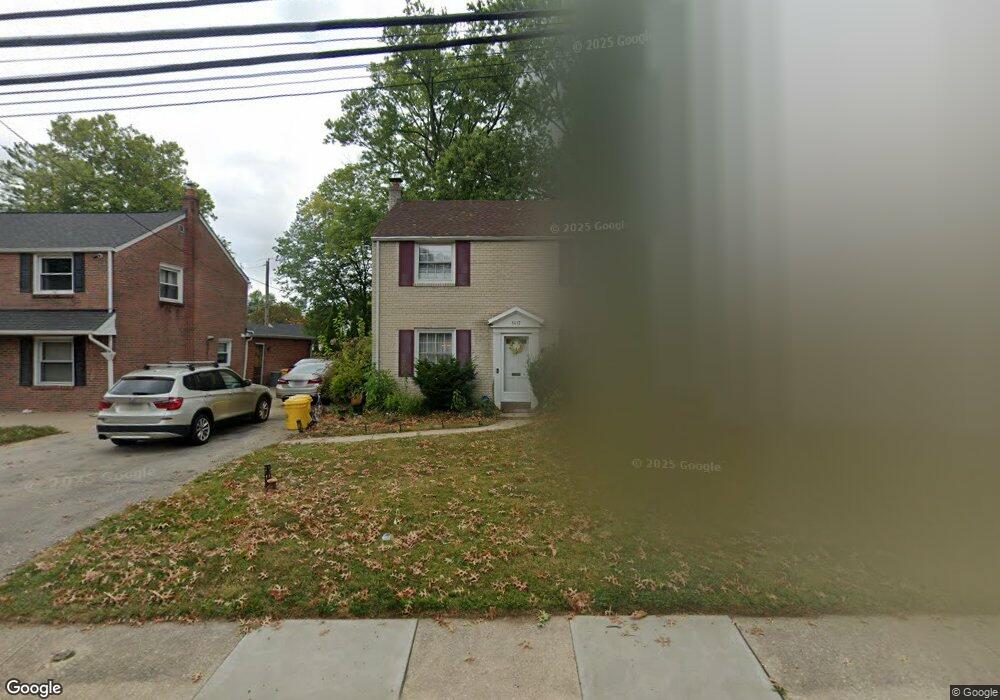
1417 Wynnewood Rd Ardmore, PA 19003
Estimated Value: $513,000 - $587,000
3
Beds
1
Bath
1,416
Sq Ft
$392/Sq Ft
Est. Value
About This Home
This home is located at 1417 Wynnewood Rd, Ardmore, PA 19003 and is currently estimated at $555,589, approximately $392 per square foot. 1417 Wynnewood Rd is a home located in Montgomery County with nearby schools including Penn Valley School, Welsh Valley Middle School, and Lower Merion High School.
Ownership History
Date
Name
Owned For
Owner Type
Purchase Details
Closed on
Apr 6, 2022
Sold by
Craig Howard Reynolds
Bought by
Roy Prodipto and Dutta Pratiti
Current Estimated Value
Home Financials for this Owner
Home Financials are based on the most recent Mortgage that was taken out on this home.
Original Mortgage
$413,250
Outstanding Balance
$389,847
Interest Rate
4.67%
Mortgage Type
New Conventional
Estimated Equity
$165,742
Purchase Details
Closed on
Apr 11, 2017
Sold by
Mccrane Howard R and Mccrane Joan M
Bought by
Howard R Craig
Purchase Details
Closed on
Feb 21, 2014
Sold by
Howard R Craig
Bought by
Howard R Craig and Mccrane Joan M
Purchase Details
Closed on
Dec 30, 1993
Sold by
Schnall Robert I and Schnall Gale
Bought by
Howard R Craig and Howard Miranda A
Create a Home Valuation Report for This Property
The Home Valuation Report is an in-depth analysis detailing your home's value as well as a comparison with similar homes in the area
Home Values in the Area
Average Home Value in this Area
Purchase History
| Date | Buyer | Sale Price | Title Company |
|---|---|---|---|
| Roy Prodipto | $435,000 | None Listed On Document | |
| Howard R Craig | -- | None Available | |
| Howard R Craig | -- | None Available | |
| Howard R Craig | $147,000 | -- |
Source: Public Records
Mortgage History
| Date | Status | Borrower | Loan Amount |
|---|---|---|---|
| Open | Roy Prodipto | $413,250 |
Source: Public Records
Tax History Compared to Growth
Tax History
| Year | Tax Paid | Tax Assessment Tax Assessment Total Assessment is a certain percentage of the fair market value that is determined by local assessors to be the total taxable value of land and additions on the property. | Land | Improvement |
|---|---|---|---|---|
| 2025 | $6,988 | $167,330 | $61,820 | $105,510 |
| 2024 | $6,988 | $167,330 | $61,820 | $105,510 |
| 2023 | $6,696 | $167,330 | $61,820 | $105,510 |
| 2022 | $6,573 | $167,330 | $61,820 | $105,510 |
| 2021 | $6,423 | $167,330 | $61,820 | $105,510 |
| 2020 | $6,266 | $167,330 | $61,820 | $105,510 |
| 2019 | $6,156 | $167,330 | $61,820 | $105,510 |
| 2018 | $6,155 | $167,330 | $61,820 | $105,510 |
| 2017 | $5,929 | $167,330 | $61,820 | $105,510 |
| 2016 | $5,864 | $167,330 | $61,820 | $105,510 |
| 2015 | $5,467 | $167,330 | $61,820 | $105,510 |
| 2014 | $5,467 | $167,330 | $61,820 | $105,510 |
Source: Public Records
Map
Nearby Homes
- 101 Grandview Rd
- 1525 W Wynnewood Rd
- 442 E Spring Ave
- 383 Lakeside Rd Unit G2
- 383 Lakeside Rd Unit 105
- 1219 W Wynnewood Rd Unit 311
- 14 Simpson Rd
- 140 Walnut Ave
- 64 E Spring Ave
- 2321 Bryn Mawr Ave
- 222 Lippincott Ave
- 754 Oak View Rd
- 2222 Bryn Mawr Ave
- 761 Hathaway Ln
- 2409 Belmont Ave
- 2814 Saint Marys Rd
- 2313 Haverford Rd
- 2528 Rosemont Ave
- 818 Clifford Ave
- 221 Ardmore Ave
- 1415 Wynnewood Rd
- 1419 Wynnewood Rd
- 1417 W Wynnewood Rd
- 1415 W Wynnewood Rd
- 1421 Wynnewood Rd
- 1413 Wynnewood Rd
- 1423 W Wynnewood Rd
- 1423 Wynnewood Rd
- 1411 W Wynnewood Rd
- 1411 Wynnewood Rd
- 117 Sutton Rd
- 119 Sutton Rd
- 115 Sutton Rd
- 1425 Wynnewood Rd
- 1425 W Wynnewood Rd
- 121 Sutton Rd
- 113 Sutton Rd
- 1409 Wynnewood Rd
- 1418 Wynnewood Rd
- 123 Sutton Rd