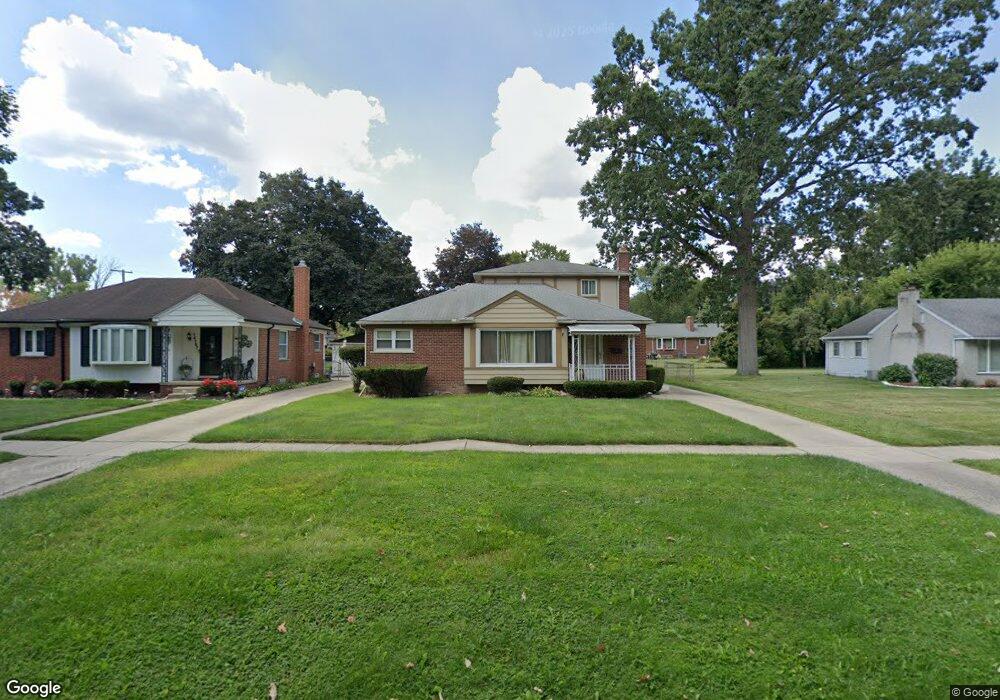
14177 Sarasota Redford, MI 48239
Estimated Value: $242,713 - $303,000
4
Beds
3
Baths
1,829
Sq Ft
$149/Sq Ft
Est. Value
About This Home
This home is located at 14177 Sarasota, Redford, MI 48239 and is currently estimated at $271,678, approximately $148 per square foot. 14177 Sarasota is a home located in Wayne County with nearby schools including John D. Pierce Middle School, Lee M. Thurston High School, and Detroit Leadership Academy.
Ownership History
Date
Name
Owned For
Owner Type
Purchase Details
Closed on
May 29, 2009
Sold by
Wells Fargo Bank Na
Bought by
Us Bank National Association
Current Estimated Value
Purchase Details
Closed on
May 28, 2009
Sold by
Fondren Lamonte and Fondren Nikole
Bought by
Wells Fargo Bank Na
Purchase Details
Closed on
Dec 6, 2005
Sold by
Harrien Darryl and Harrien Lisa
Bought by
Fondren Lamonte
Purchase Details
Closed on
Jan 17, 2003
Sold by
Kapler Joseph E and Kapler Dorothy J
Bought by
Harrien Darryl
Create a Home Valuation Report for This Property
The Home Valuation Report is an in-depth analysis detailing your home's value as well as a comparison with similar homes in the area
Home Values in the Area
Average Home Value in this Area
Purchase History
| Date | Buyer | Sale Price | Title Company |
|---|---|---|---|
| Us Bank National Association | -- | None Available | |
| Wells Fargo Bank Na | $51,000 | None Available | |
| Fondren Lamonte | $202,000 | Great Lakes Title Of Mi | |
| Harrien Darryl | $199,000 | Multiple |
Source: Public Records
Tax History Compared to Growth
Tax History
| Year | Tax Paid | Tax Assessment Tax Assessment Total Assessment is a certain percentage of the fair market value that is determined by local assessors to be the total taxable value of land and additions on the property. | Land | Improvement |
|---|---|---|---|---|
| 2025 | $1,035 | $114,800 | $0 | $0 |
| 2024 | $1,035 | $107,400 | $0 | $0 |
| 2023 | $991 | $96,600 | $0 | $0 |
| 2022 | $2,847 | $85,600 | $0 | $0 |
| 2021 | $2,767 | $79,200 | $0 | $0 |
| 2020 | $2,728 | $67,800 | $0 | $0 |
| 2019 | $2,668 | $62,800 | $0 | $0 |
| 2018 | $892 | $51,400 | $0 | $0 |
| 2017 | $3,087 | $48,400 | $0 | $0 |
| 2016 | $2,406 | $45,500 | $0 | $0 |
| 2015 | $3,747 | $41,100 | $0 | $0 |
| 2013 | $3,630 | $37,900 | $0 | $0 |
| 2012 | $2,214 | $41,300 | $7,900 | $33,400 |
Source: Public Records
Map
Nearby Homes