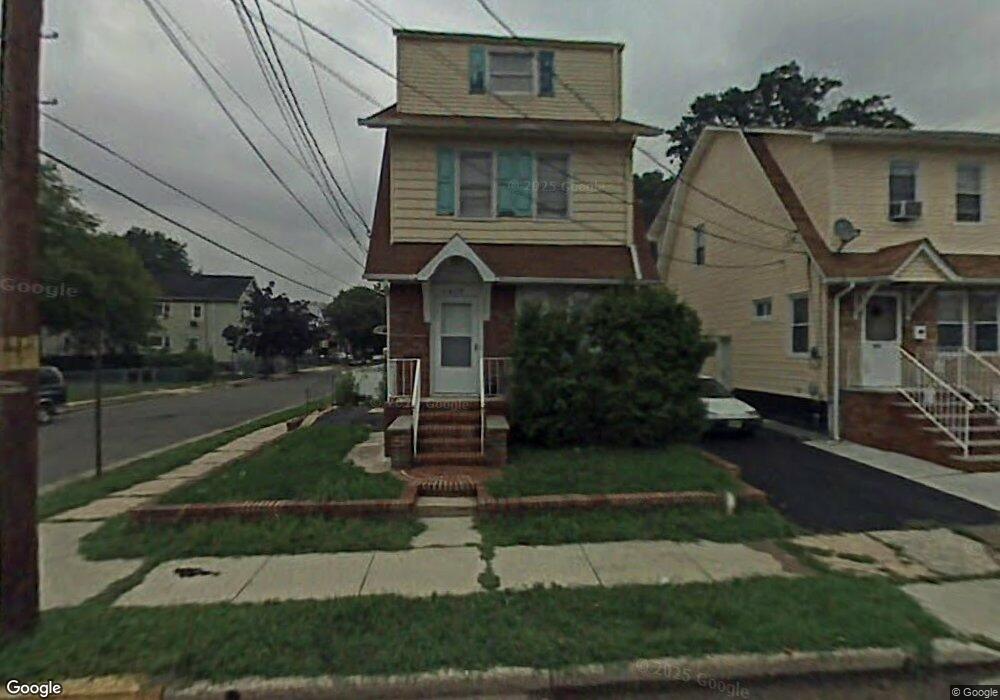
1418 Bower St Linden, NJ 07036
Estimated Value: $340,000 - $434,000
--
Bed
--
Bath
512
Sq Ft
$788/Sq Ft
Est. Value
About This Home
This home is located at 1418 Bower St, Linden, NJ 07036 and is currently estimated at $403,339, approximately $787 per square foot. 1418 Bower St is a home located in Union County with nearby schools including School No. 5, Joseph E. Soehl Middle School, and Linden High School.
Ownership History
Date
Name
Owned For
Owner Type
Purchase Details
Closed on
Jul 15, 2005
Sold by
Soto Diana
Bought by
Batelus Yvan and Batelus Paulma
Current Estimated Value
Home Financials for this Owner
Home Financials are based on the most recent Mortgage that was taken out on this home.
Original Mortgage
$228,000
Outstanding Balance
$118,480
Interest Rate
5.59%
Mortgage Type
New Conventional
Estimated Equity
$284,859
Purchase Details
Closed on
Feb 11, 2004
Sold by
Siljee Daniel
Bought by
Soto Diana and Soto Diamedes
Home Financials for this Owner
Home Financials are based on the most recent Mortgage that was taken out on this home.
Original Mortgage
$208,684
Interest Rate
5.83%
Mortgage Type
FHA
Purchase Details
Closed on
Aug 22, 2003
Sold by
Hammock Marvin
Bought by
Siljee Daniel
Home Financials for this Owner
Home Financials are based on the most recent Mortgage that was taken out on this home.
Original Mortgage
$155,000
Interest Rate
6.31%
Create a Home Valuation Report for This Property
The Home Valuation Report is an in-depth analysis detailing your home's value as well as a comparison with similar homes in the area
Home Values in the Area
Average Home Value in this Area
Purchase History
| Date | Buyer | Sale Price | Title Company |
|---|---|---|---|
| Batelus Yvan | $285,000 | -- | |
| Soto Diana | $212,000 | -- | |
| Siljee Daniel | $142,000 | -- |
Source: Public Records
Mortgage History
| Date | Status | Borrower | Loan Amount |
|---|---|---|---|
| Open | Batelus Yvan | $228,000 | |
| Previous Owner | Soto Diana | $208,684 | |
| Previous Owner | Siljee Daniel | $155,000 |
Source: Public Records
Tax History Compared to Growth
Tax History
| Year | Tax Paid | Tax Assessment Tax Assessment Total Assessment is a certain percentage of the fair market value that is determined by local assessors to be the total taxable value of land and additions on the property. | Land | Improvement |
|---|---|---|---|---|
| 2025 | $7,588 | $107,900 | $40,500 | $67,400 |
| 2024 | $7,421 | $107,900 | $40,500 | $67,400 |
| 2023 | $7,421 | $107,900 | $40,500 | $67,400 |
| 2022 | $7,460 | $107,900 | $40,500 | $67,400 |
| 2021 | $7,498 | $107,900 | $40,500 | $67,400 |
| 2020 | $7,458 | $107,900 | $40,500 | $67,400 |
| 2019 | $7,433 | $107,900 | $40,500 | $67,400 |
| 2018 | $7,431 | $107,900 | $40,500 | $67,400 |
| 2017 | $7,270 | $107,900 | $40,500 | $67,400 |
| 2016 | $7,042 | $107,900 | $40,500 | $67,400 |
| 2015 | $6,773 | $107,900 | $40,500 | $67,400 |
| 2014 | $6,641 | $107,900 | $40,500 | $67,400 |
Source: Public Records
Map
Nearby Homes
- 1414 Bower St
- 1412 Bower St
- 712 Van Buren Ave
- 1500 Bower St
- 1406 Bower St
- 716 Van Buren Ave
- 713 Jackson Ave
- 1506 Bower St
- 1400 Bower St
- 1417 Bower St
- 713 Van Buren Ave
- 715 Jackson Ave
- 1413 Bower St
- 641 Van Buren Ave
- 641 Van Buren Ave Unit 2
- 722 Van Buren Ave
- 717 Van Buren Ave
- 719 Jackson Ave
- 1407 Bower St
- 1510 Bower St