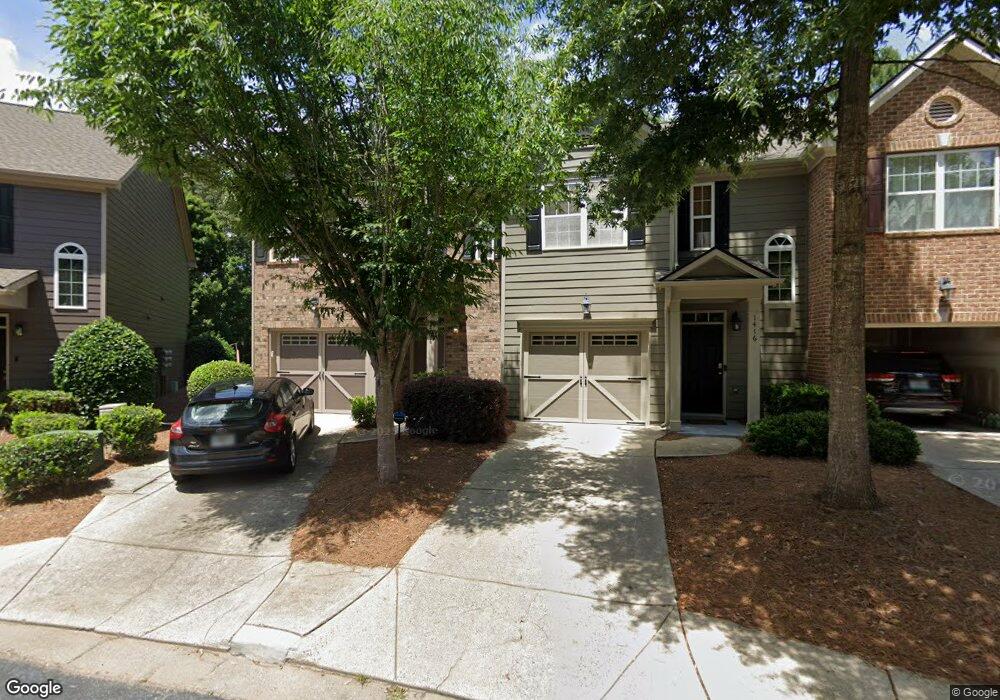
1418 Dolcetto Trace NW Kennesaw, GA 30152
Estimated Value: $321,000 - $334,935
3
Beds
3
Baths
1,604
Sq Ft
$203/Sq Ft
Est. Value
About This Home
This home is located at 1418 Dolcetto Trace NW, Kennesaw, GA 30152 and is currently estimated at $326,234, approximately $203 per square foot. 1418 Dolcetto Trace NW is a home located in Cobb County with nearby schools including Hayes Elementary School, Pine Mountain Middle School, and Kennesaw Mountain High School.
Ownership History
Date
Name
Owned For
Owner Type
Purchase Details
Closed on
May 26, 2023
Sold by
Caplan Nancy Jean
Bought by
Tiongco Juan Carlos Pleyt and Hollowell Megan Leigh
Current Estimated Value
Home Financials for this Owner
Home Financials are based on the most recent Mortgage that was taken out on this home.
Original Mortgage
$301,500
Outstanding Balance
$293,117
Interest Rate
6.39%
Mortgage Type
New Conventional
Estimated Equity
$33,118
Purchase Details
Closed on
Dec 31, 2019
Sold by
Grady Joan
Bought by
Caplan Nancy
Home Financials for this Owner
Home Financials are based on the most recent Mortgage that was taken out on this home.
Original Mortgage
$129,900
Interest Rate
3.6%
Mortgage Type
New Conventional
Purchase Details
Closed on
Jun 20, 2006
Sold by
Mccar Hms Inc
Bought by
Grady Joan
Create a Home Valuation Report for This Property
The Home Valuation Report is an in-depth analysis detailing your home's value as well as a comparison with similar homes in the area
Home Values in the Area
Average Home Value in this Area
Purchase History
| Date | Buyer | Sale Price | Title Company |
|---|---|---|---|
| Tiongco Juan Carlos Pleyt | $335,000 | None Listed On Document | |
| Caplan Nancy | $209,900 | -- | |
| Grady Joan | $182,700 | -- |
Source: Public Records
Mortgage History
| Date | Status | Borrower | Loan Amount |
|---|---|---|---|
| Open | Tiongco Juan Carlos Pleyt | $301,500 | |
| Previous Owner | Caplan Nancy | $129,900 |
Source: Public Records
Tax History Compared to Growth
Tax History
| Year | Tax Paid | Tax Assessment Tax Assessment Total Assessment is a certain percentage of the fair market value that is determined by local assessors to be the total taxable value of land and additions on the property. | Land | Improvement |
|---|---|---|---|---|
| 2025 | $3,968 | $131,696 | $32,000 | $99,696 |
| 2024 | $3,971 | $131,696 | $32,000 | $99,696 |
| 2023 | $742 | $124,612 | $20,000 | $104,612 |
| 2022 | $877 | $100,816 | $20,000 | $80,816 |
| 2021 | $837 | $87,260 | $20,000 | $67,260 |
| 2020 | $2,369 | $78,056 | $20,000 | $58,056 |
| 2019 | $697 | $78,056 | $20,000 | $58,056 |
| 2018 | $676 | $71,068 | $22,000 | $49,068 |
| 2017 | $579 | $67,596 | $15,200 | $52,396 |
| 2016 | $522 | $59,760 | $15,200 | $44,560 |
| 2015 | $438 | $48,456 | $15,200 | $33,256 |
| 2014 | $446 | $48,456 | $0 | $0 |
Source: Public Records
Map
Nearby Homes
- 1384 Dolcetto Trace NW
- 1414 Dolcetto Trace NW Unit 14
- 1376 Dolcetto Trace NW Unit 10
- 1466 Dolcetto Trace NW Unit 18
- 1511 Dolcetto Trace NW Unit 1
- 1327 Bexley Place NW Unit 6
- 1729 Ridenour Pkwy NW Unit 1
- 1737 Taynton Cir NW
- 1827 Willow Branch Ln NW Unit M
- 1241 Gates Mill Dr NW Unit 13
- 1776 Willow Branch Ln NW Unit E
- 1177 Ridenour Blvd NW Unit 6
- 1212 Gates Mill Dr NW
- 1736 Stanwood Dr NW
- 1741 Stanwood Dr NW
- 1676 Perserverence Hill Cir NW Unit 4
- 1233 Ridenour Ln
- 1534 Endurance Hill Dr NW Unit 9
- 1418 Dolcetto Trace NW Unit 14
- 1416 Dolcetto Trace NW Unit 14
- 1414 Dolcetto Trace NW Unit 1414
- 1414 Dolcetto Trace NW
- 1414 Dolcetto Trace NW Unit 1414
- 1422 Dolcetto Trace NW Unit 15
- 1410 Dolcetto Trace NW Unit 13
- 1426 Dolcetto Trace NW Unit 1426
- 1426 Dolcetto Trace NW Unit 15
- 1426 Dolcetto Trace NW
- 1428 Dolcetto Trace NW Unit 15
- 1428 Dolcetto Trace NW
- 1428 Dolcetto Trace NW Unit 1428
- 1408 Dolcetto Trace NW
- 1406 Dolcetto Trace NW Unit 13
- 1406 Dolcetto Trace NW
- 1406 Dolcetto Trace NW Unit 1406
- 1430 Dolcetto Trace NW Unit 15
- 1430 Dolcetto Trace NW
- 1432 Dolcetto Trace NW Unit 15