Estimated Value: $573,000 - $708,563
5
Beds
3
Baths
3,676
Sq Ft
$183/Sq Ft
Est. Value
About This Home
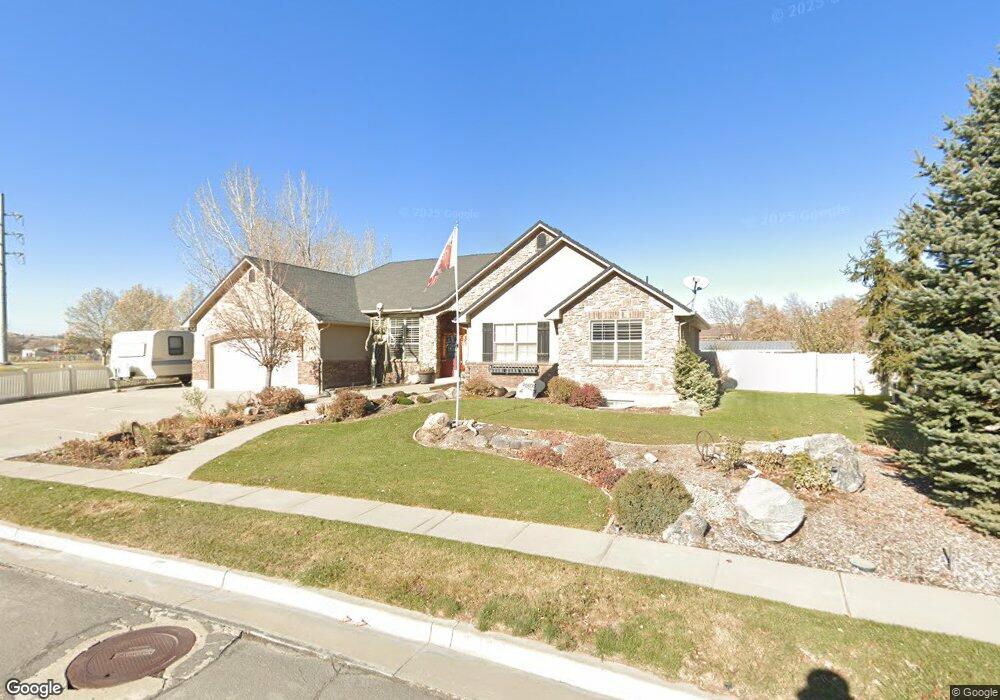
This home is located at 1418 E 7425 S, Ogden, UT 84405 and is currently estimated at $672,891, approximately $183 per square foot. 1418 E 7425 S is a home located in Davis County with nearby schools including South Weber Elementary School, Sunset Junior High School, and Northridge High School.
Ownership History
Date
Name
Owned For
Owner Type
Purchase Details
Closed on
Mar 5, 2025
Sold by
Powers Kris and Powers David
Bought by
Powers Family Trust and Powers
Current Estimated Value
Purchase Details
Closed on
Jun 8, 2012
Sold by
Warrick Curtis and Warrick Shawna
Bought by
Warrick Curtis W and Warrick Shawna J
Home Financials for this Owner
Home Financials are based on the most recent Mortgage that was taken out on this home.
Original Mortgage
$287,000
Interest Rate
3.79%
Mortgage Type
New Conventional
Purchase Details
Closed on
Aug 4, 2006
Sold by
R J Westbroek Construction Inc
Bought by
Warrick Curtis and Warrick Shawna
Home Financials for this Owner
Home Financials are based on the most recent Mortgage that was taken out on this home.
Original Mortgage
$239,550
Interest Rate
6.76%
Mortgage Type
Purchase Money Mortgage
Purchase Details
Closed on
Apr 18, 2005
Sold by
Us Development Inc
Bought by
Rj Westbroek Construction Inc
Create a Home Valuation Report for This Property
The Home Valuation Report is an in-depth analysis detailing your home's value as well as a comparison with similar homes in the area
Home Values in the Area
Average Home Value in this Area
Purchase History
| Date | Buyer | Sale Price | Title Company |
|---|---|---|---|
| Powers Family Trust | -- | None Listed On Document | |
| Powers Family Trust | -- | None Listed On Document | |
| Warrick Curtis W | -- | Absolute Title Ins Ag | |
| Warrick Curtis | -- | Mountain View Title & Escrow | |
| Rj Westbroek Construction Inc | -- | None Available |
Source: Public Records
Mortgage History
| Date | Status | Borrower | Loan Amount |
|---|---|---|---|
| Previous Owner | Warrick Curtis W | $287,000 | |
| Previous Owner | Warrick Curtis | $239,550 |
Source: Public Records
Tax History Compared to Growth
Tax History
| Year | Tax Paid | Tax Assessment Tax Assessment Total Assessment is a certain percentage of the fair market value that is determined by local assessors to be the total taxable value of land and additions on the property. | Land | Improvement |
|---|---|---|---|---|
| 2025 | $3,424 | $380,600 | $119,136 | $261,464 |
| 2024 | $3,424 | $347,600 | $95,945 | $251,655 |
| 2023 | $3,374 | $619,000 | $155,979 | $463,021 |
| 2022 | $3,535 | $356,950 | $73,768 | $283,182 |
| 2021 | $3,283 | $506,000 | $111,658 | $394,342 |
| 2020 | $2,943 | $442,000 | $104,586 | $337,414 |
| 2019 | $2,885 | $423,000 | $103,180 | $319,820 |
| 2018 | $2,556 | $394,000 | $95,712 | $298,288 |
| 2016 | $2,324 | $187,055 | $38,485 | $148,570 |
| 2015 | $2,444 | $186,175 | $38,485 | $147,690 |
| 2014 | $2,464 | $191,048 | $44,236 | $146,812 |
| 2013 | -- | $158,088 | $33,440 | $124,648 |
Source: Public Records
Map
Nearby Homes
- 1437 E 7425 S
- 1577 E South Weber Dr Unit 3
- 7320 S 1250 E
- 1308 E Canyon Dr
- 7274 S 1600 E
- 1647 E Bateman Way
- 1080 E Lester Dr
- 1058 E South Bench Dr Unit 3
- 7496 S 1740 E
- 7427 Shay Ln
- 1645 E 6800 S
- 7212 S Harolds Way
- 1947 E 7470 S
- 7544 S 2020 E
- 2002 Deer Run Dr
- 1403 E 6175 S
- 1411 E 6175 S
- 975 E 6600 S Unit 41
- 975 E 6600 S Unit 7
- 975 E 6600 S Unit 5