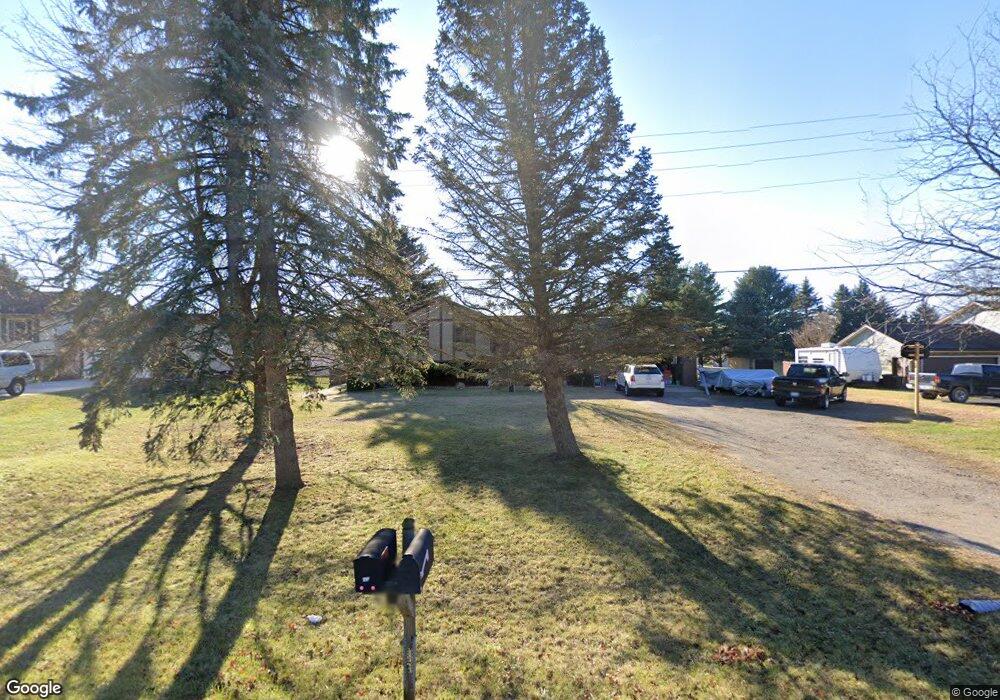
1418 E Sawdust Corners Rd Unit Bldg-Unit Lapeer, MI 48446
Estimated Value: $277,897 - $319,000
3
Beds
2
Baths
1,292
Sq Ft
$225/Sq Ft
Est. Value
About This Home
This home is located at 1418 E Sawdust Corners Rd Unit Bldg-Unit, Lapeer, MI 48446 and is currently estimated at $290,224, approximately $224 per square foot. 1418 E Sawdust Corners Rd Unit Bldg-Unit is a home located in Lapeer County with nearby schools including Rolland-Warner Middle School and Lapeer High School.
Ownership History
Date
Name
Owned For
Owner Type
Purchase Details
Closed on
Jun 4, 2018
Sold by
Lackey and Latiscia
Bought by
Alberty Vincent
Current Estimated Value
Home Financials for this Owner
Home Financials are based on the most recent Mortgage that was taken out on this home.
Original Mortgage
$191,818
Outstanding Balance
$165,515
Interest Rate
4.4%
Mortgage Type
New Conventional
Estimated Equity
$124,709
Purchase Details
Closed on
May 23, 2018
Sold by
Lackey Donnie and Lackey Latiscia
Bought by
Alberty Vincent
Home Financials for this Owner
Home Financials are based on the most recent Mortgage that was taken out on this home.
Original Mortgage
$191,818
Outstanding Balance
$165,515
Interest Rate
4.4%
Mortgage Type
New Conventional
Estimated Equity
$124,709
Purchase Details
Closed on
Oct 24, 2014
Sold by
Katzmark Kim R and Katzmark Peggy Ann
Bought by
Lackey Donnie and Lackey Latiiscia
Create a Home Valuation Report for This Property
The Home Valuation Report is an in-depth analysis detailing your home's value as well as a comparison with similar homes in the area
Home Values in the Area
Average Home Value in this Area
Purchase History
| Date | Buyer | Sale Price | Title Company |
|---|---|---|---|
| Alberty Vincent | $189,900 | None Listed On Document | |
| Alberty Vincent | $189,900 | -- | |
| Alberty Vincent | $189,900 | None Listed On Document | |
| Lackey Donnie | $141,000 | -- |
Source: Public Records
Mortgage History
| Date | Status | Borrower | Loan Amount |
|---|---|---|---|
| Open | Alberty Vincent | $191,818 | |
| Closed | Alberty Vincent | $191,818 |
Source: Public Records
Tax History Compared to Growth
Tax History
| Year | Tax Paid | Tax Assessment Tax Assessment Total Assessment is a certain percentage of the fair market value that is determined by local assessors to be the total taxable value of land and additions on the property. | Land | Improvement |
|---|---|---|---|---|
| 2025 | $1,978 | $126,800 | $0 | $0 |
| 2024 | $910 | $104,800 | $0 | $0 |
| 2023 | $869 | $101,500 | $0 | $0 |
| 2022 | $1,789 | $96,600 | $0 | $0 |
| 2021 | $1,630 | $87,000 | $0 | $0 |
| 2020 | $1,609 | $85,400 | $0 | $0 |
| 2019 | $1,645 | $79,800 | $0 | $0 |
| 2018 | $1,304 | $72,500 | $72,500 | $0 |
| 2017 | $1,279 | $74,000 | $0 | $0 |
| 2016 | $1,273 | $69,800 | $69,800 | $0 |
| 2015 | -- | $61,200 | $0 | $0 |
| 2014 | -- | $48,700 | $48,700 | $0 |
| 2013 | -- | $52,100 | $52,100 | $0 |
Source: Public Records
Map
Nearby Homes
- 180 Maverick Ln
- 3729 N Lapeer Rd
- 1972 E Norway Lake Rd
- 355 Dockham Rd
- 73 Dockham Rd
- 2148 Vernor Rd
- 500 W Norway Lake Rd
- 2173 Fawn Glen Cir
- 3732 Fish Lake Rd
- 2817 Valentine Rd
- VL Roods Lake Rd
- 3040 Millville Rd
- 4991 Millis Rd
- V/L Woodlawn Dr
- Vacant Land Skelton Rd
- 1829 Farnsworth Rd
- 3236 Shady Oak Dr
- 631 Pine Dr
- 1938 Mayfield Rd
- 2307 Millville Rd
- 1418 E Sawdust Corners Rd
- 1406 E Sawdust Corners Rd
- 1413 E Sawdust Corners Rd
- 1396 E Sawdust Corners Rd
- 1430 E Sawdust Corners Rd
- 1431 E Sawdust Corners Rd
- 1384 E Sawdust Corners Rd
- 1440 E Sawdust Corners Rd
- 1372 E Sawdust Corners Rd
- 1375 E Sawdust Corners Rd
- 1450 E Sawdust Corners Rd
- 3477 Woodvalley Dr
- 3467 Woodvalley Dr
- 3457 Woodvalley Dr
- 1460 E Sawdust Corners Rd
- 1385 Old Mill Rd
- 1395 Old Mill Rd
- 1405 Old Mill Rd
- 1431 Old Mill Rd
- 1439 Old Mill Rd