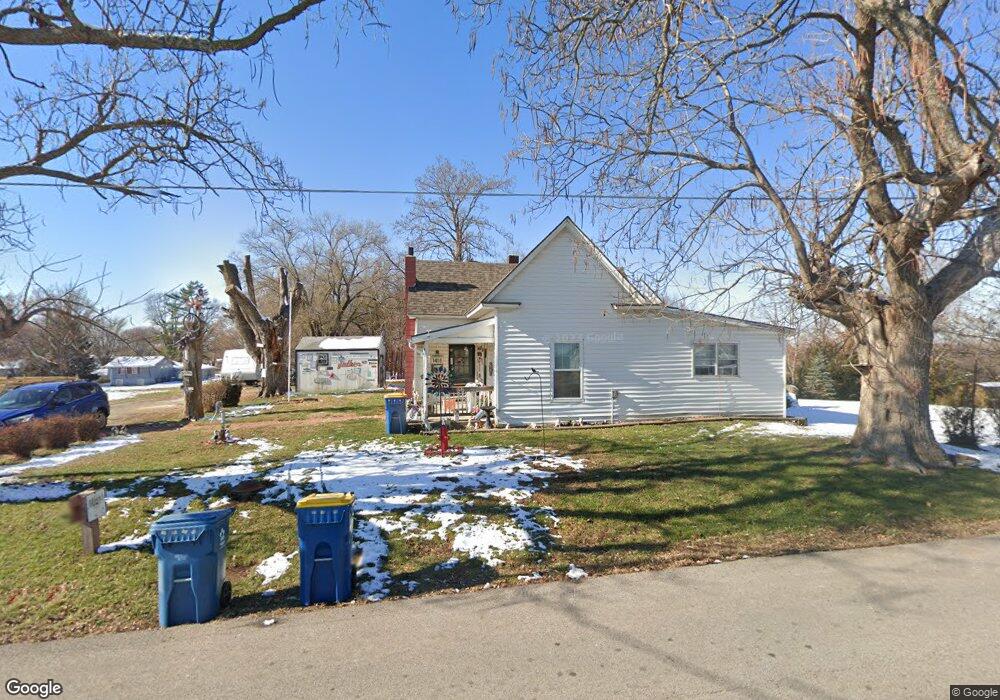
1418 Orrick Rd Excelsior Springs, MO 64024
Estimated Value: $110,000 - $235,000
3
Beds
1
Bath
1,106
Sq Ft
$158/Sq Ft
Est. Value
About This Home
This home is located at 1418 Orrick Rd, Excelsior Springs, MO 64024 and is currently estimated at $174,710, approximately $157 per square foot. 1418 Orrick Rd is a home located in Clay County with nearby schools including Excelsior Springs High School.
Ownership History
Date
Name
Owned For
Owner Type
Purchase Details
Closed on
Oct 24, 2006
Sold by
Ward Chester and Ward June
Bought by
Spear Joe C and Spear Sandy
Current Estimated Value
Home Financials for this Owner
Home Financials are based on the most recent Mortgage that was taken out on this home.
Original Mortgage
$57,500
Outstanding Balance
$34,216
Interest Rate
6.41%
Mortgage Type
Purchase Money Mortgage
Estimated Equity
$140,494
Purchase Details
Closed on
Jul 13, 2000
Sold by
Hud
Bought by
Ward Chester D and Ward June M
Home Financials for this Owner
Home Financials are based on the most recent Mortgage that was taken out on this home.
Original Mortgage
$46,400
Interest Rate
9.25%
Purchase Details
Closed on
Feb 25, 1997
Sold by
Mckown David L and Mckown Shelley Y
Bought by
Harris Stephen E
Home Financials for this Owner
Home Financials are based on the most recent Mortgage that was taken out on this home.
Original Mortgage
$51,295
Interest Rate
7.92%
Mortgage Type
FHA
Create a Home Valuation Report for This Property
The Home Valuation Report is an in-depth analysis detailing your home's value as well as a comparison with similar homes in the area
Home Values in the Area
Average Home Value in this Area
Purchase History
| Date | Buyer | Sale Price | Title Company |
|---|---|---|---|
| Spear Joe C | -- | Kansas City Title | |
| Ward Chester D | -- | Stewart Title | |
| Harris Stephen E | -- | -- |
Source: Public Records
Mortgage History
| Date | Status | Borrower | Loan Amount |
|---|---|---|---|
| Open | Spear Joe C | $57,500 | |
| Previous Owner | Ward Chester D | $46,400 | |
| Previous Owner | Harris Stephen E | $51,295 | |
| Closed | Harris Stephen E | $2,600 |
Source: Public Records
Tax History Compared to Growth
Tax History
| Year | Tax Paid | Tax Assessment Tax Assessment Total Assessment is a certain percentage of the fair market value that is determined by local assessors to be the total taxable value of land and additions on the property. | Land | Improvement |
|---|---|---|---|---|
| 2025 | $937 | $14,120 | -- | -- |
| 2024 | $937 | $13,360 | -- | -- |
| 2023 | $931 | $13,360 | $0 | $0 |
| 2022 | $847 | $11,950 | $0 | $0 |
| 2021 | $850 | $11,951 | $2,660 | $9,291 |
| 2020 | $911 | $12,450 | $0 | $0 |
| 2019 | $910 | $12,445 | $2,660 | $9,785 |
| 2018 | $783 | $10,680 | $0 | $0 |
| 2017 | $764 | $10,680 | $1,710 | $8,970 |
| 2016 | $764 | $10,680 | $1,710 | $8,970 |
| 2015 | $771 | $10,680 | $1,710 | $8,970 |
| 2014 | $727 | $9,970 | $1,710 | $8,260 |
Source: Public Records
Map
Nearby Homes
- Track 2 Orrick Rd
- 12297 Orrick Rd
- 12415 Morgan St
- 12402 Morgan St
- 12404 Morgan St
- 904 E Golf Hill Dr
- 1111 Old Time Dr
- 8 Orchard Place
- 0 Park Ave
- 811 Saint Louis Ave
- 115 Saratoga Ave
- 106 Saratoga St
- 31766 Horn Cir
- 256 E Broadway Ave
- 610 St Louis Ave
- 602 Saint Louis Ave
- 607 Old Orchard Ave
- 0 Highway O Hwy Unit HMS2592209
- 1113 Melanie Ln
- 101 W Excelsior St