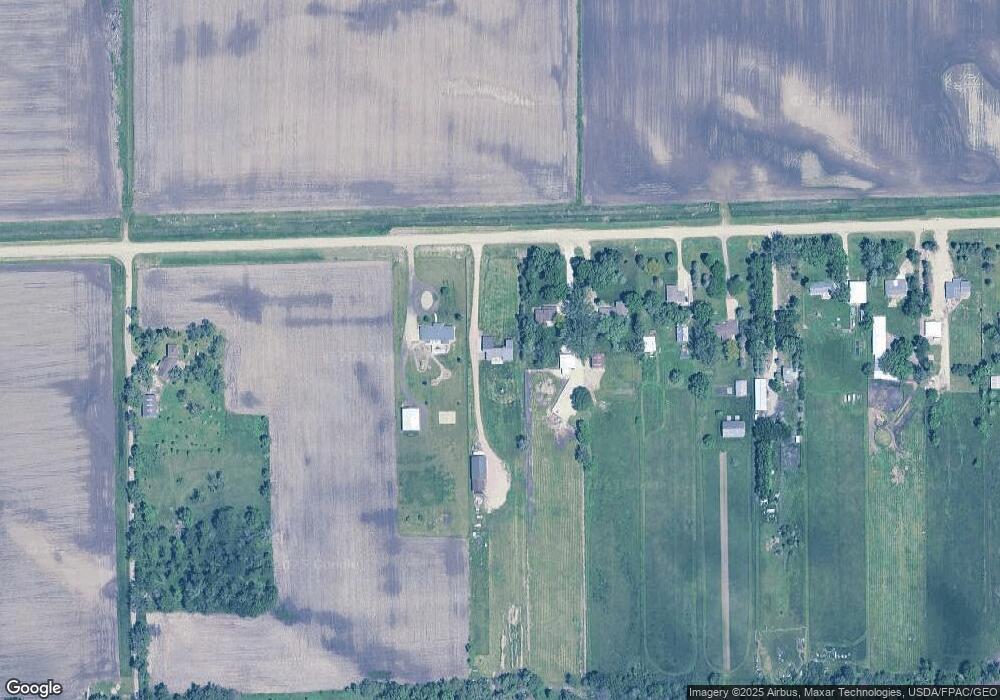
1419 210th St Sergeant Bluff, IA 51054
Estimated Value: $610,000 - $781,583
7
Beds
4
Baths
4,674
Sq Ft
$149/Sq Ft
Est. Value
About This Home
This home is located at 1419 210th St, Sergeant Bluff, IA 51054 and is currently estimated at $695,792, approximately $148 per square foot. 1419 210th St is a home located in Woodbury County with nearby schools including Sergeant Bluff-Luton Primary School, Sergeant Bluff-Luton Elementary School, and Sergeant Bluff-Luton Middle School.
Ownership History
Date
Name
Owned For
Owner Type
Purchase Details
Closed on
Mar 10, 2014
Sold by
Beller Douglas James and Beller Mary Anne
Bought by
Baker Eric J and Baker Erin S
Current Estimated Value
Home Financials for this Owner
Home Financials are based on the most recent Mortgage that was taken out on this home.
Original Mortgage
$375,000
Interest Rate
4.41%
Mortgage Type
Future Advance Clause Open End Mortgage
Create a Home Valuation Report for This Property
The Home Valuation Report is an in-depth analysis detailing your home's value as well as a comparison with similar homes in the area
Purchase History
| Date | Buyer | Sale Price | Title Company |
|---|---|---|---|
| Baker Eric J | $75,000 | None Available |
Source: Public Records
Mortgage History
| Date | Status | Borrower | Loan Amount |
|---|---|---|---|
| Closed | Baker Eric J | $375,000 |
Source: Public Records
Tax History
| Year | Tax Paid | Tax Assessment Tax Assessment Total Assessment is a certain percentage of the fair market value that is determined by local assessors to be the total taxable value of land and additions on the property. | Land | Improvement |
|---|---|---|---|---|
| 2025 | $7,710 | $729,610 | $84,000 | $645,610 |
| 2024 | $74 | $736,020 | $56,250 | $679,770 |
| 2023 | $6,038 | $736,020 | $56,250 | $679,770 |
| 2022 | $5,984 | $508,810 | $56,250 | $452,560 |
| 2021 | $5,968 | $508,810 | $56,250 | $452,560 |
| 2020 | $5,301 | $434,220 | $60,190 | $374,030 |
| 2019 | $5,175 | $434,220 | $60,190 | $374,030 |
| 2018 | $5,133 | $420,840 | $46,810 | $374,030 |
| 2017 | $5,112 | $420,840 | $46,810 | $374,030 |
| 2016 | $3,198 | $420,840 | $0 | $0 |
| 2015 | $1,052 | $205,060 | $43,750 | $161,310 |
| 2014 | $999 | $35,000 | $35,000 | $0 |
Source: Public Records
Map
Nearby Homes
Your Personal Tour Guide
Ask me questions while you tour the home.