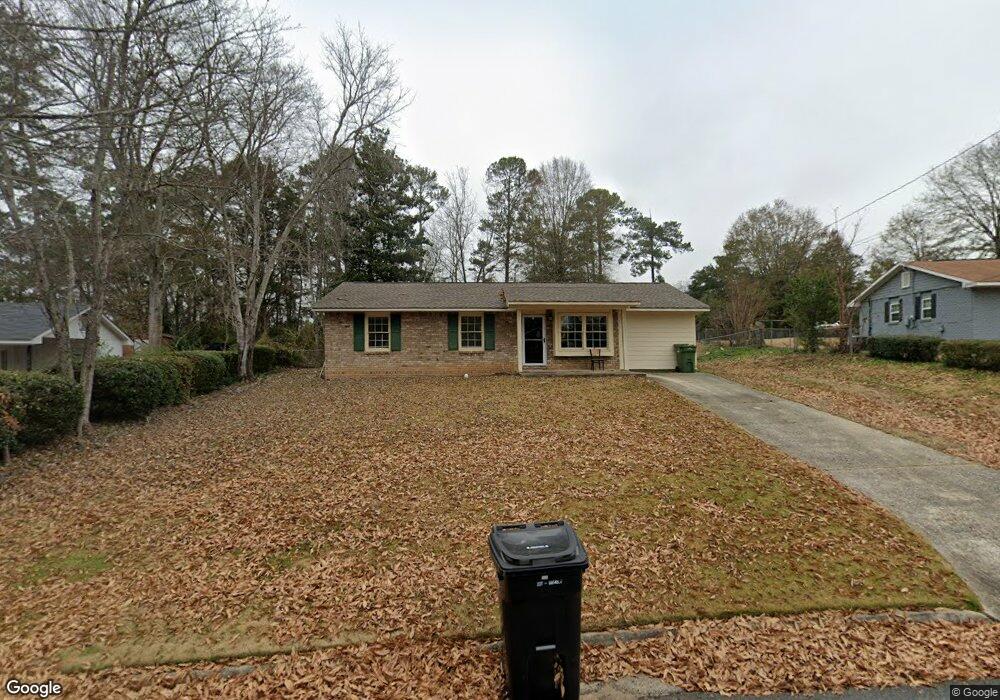
1419 Briarlock Rd Columbus, GA 31904
Northern Columbus NeighborhoodEstimated Value: $176,000 - $198,000
3
Beds
2
Baths
1,296
Sq Ft
$148/Sq Ft
Est. Value
About This Home
This home is located at 1419 Briarlock Rd, Columbus, GA 31904 and is currently estimated at $192,313, approximately $148 per square foot. 1419 Briarlock Rd is a home located in Muscogee County with nearby schools including Double Churches Elementary School, Veterans Memorial Middle School, and Northside High School.
Ownership History
Date
Name
Owned For
Owner Type
Purchase Details
Closed on
Apr 25, 2024
Sold by
Patel Bipinkumar
Bought by
Patel Bipinkumar and Patel Hitesita B
Current Estimated Value
Purchase Details
Closed on
Dec 10, 2020
Sold by
Munn Larry Joe
Bought by
Patel Bipinkumar
Home Financials for this Owner
Home Financials are based on the most recent Mortgage that was taken out on this home.
Original Mortgage
$99,375
Interest Rate
2.8%
Mortgage Type
New Conventional
Purchase Details
Closed on
Apr 21, 2014
Sold by
Munn Terrie
Bought by
Munn Larry Joe
Home Financials for this Owner
Home Financials are based on the most recent Mortgage that was taken out on this home.
Original Mortgage
$72,000
Interest Rate
4.37%
Mortgage Type
New Conventional
Purchase Details
Closed on
Feb 22, 2011
Sold by
Lashley Sherry A
Bought by
Lashley Sherry A and Munn Terrie R
Create a Home Valuation Report for This Property
The Home Valuation Report is an in-depth analysis detailing your home's value as well as a comparison with similar homes in the area
Home Values in the Area
Average Home Value in this Area
Purchase History
| Date | Buyer | Sale Price | Title Company |
|---|---|---|---|
| Patel Bipinkumar | -- | None Listed On Document | |
| Patel Bipinkumar | $132,500 | -- | |
| Munn Larry Joe | $70,000 | -- | |
| Munn Terrie | $70,000 | -- | |
| Lashley Sherry A | -- | None Available | |
| Lashley Sherry A | -- | None Available |
Source: Public Records
Mortgage History
| Date | Status | Borrower | Loan Amount |
|---|---|---|---|
| Previous Owner | Patel Bipinkumar | $99,375 | |
| Previous Owner | Munn Terrie | $72,000 |
Source: Public Records
Tax History Compared to Growth
Tax History
| Year | Tax Paid | Tax Assessment Tax Assessment Total Assessment is a certain percentage of the fair market value that is determined by local assessors to be the total taxable value of land and additions on the property. | Land | Improvement |
|---|---|---|---|---|
| 2025 | $2,583 | $65,980 | $9,436 | $56,544 |
| 2024 | $2,583 | $65,980 | $9,436 | $56,544 |
| 2023 | $2,599 | $65,980 | $9,436 | $56,544 |
| 2022 | $2,164 | $53,000 | $9,436 | $43,564 |
| 2021 | $2,169 | $53,000 | $9,436 | $43,564 |
| 2020 | $1,193 | $42,600 | $9,436 | $33,164 |
| 2019 | $1,199 | $42,600 | $9,436 | $33,164 |
| 2018 | $1,199 | $42,600 | $9,436 | $33,164 |
| 2017 | $1,204 | $42,600 | $9,436 | $33,164 |
| 2016 | $1,155 | $28,000 | $5,230 | $22,770 |
| 2015 | $463 | $28,000 | $5,230 | $22,770 |
| 2014 | $211 | $25,994 | $5,230 | $20,764 |
| 2013 | -- | $25,994 | $5,230 | $20,764 |
Source: Public Records
Map
Nearby Homes
- 8344 Twin Chapel Dr
- 1579 Magnolia Way
- 928 Heiferhorn Trace
- 1535 Doubletree Dr
- 1727 Fountain Ct
- 1058 Cedarbrook Dr
- 7170 Bridgemill Dr
- 8259 Lantern Ln
- 7841 Edgewater Dr
- 7701 Gray Shoals Dr
- 7995 Big Creek Place
- 1438 Grove Park Dr Unit 13B
- 7635 Edgewater Dr
- 1719 Double Churches Rd
- Belmont Plan at Heiferhorn Farms
- Cypress Plan at Heiferhorn Farms
- Harrison Plan at Heiferhorn Farms
- Oakwood Plan at Heiferhorn Farms
- Maple Plan at Heiferhorn Farms
- Spruce Plan at Heiferhorn Farms
- 1427 Briarlock Rd
- 1413 Briarlock Rd
- 1407 Briarlock Rd
- 1435 Briarlock Rd
- 1536 Ridge Creek Way
- 1540 Ridge Creek Way
- 1532 Ridge Creek Way
- 1420 Briarlock Rd
- 1441 Briarlock Rd
- 1401 Briarlock Rd
- 8318 Trafalgar Way
- 1434 Briarlock Rd
- 1410 Briarlock Rd
- 8326 Trafalgar Way
- 8246 Trafalgar Way
- 1528 Ridge Creek Way
- 1440 Briarlock Rd
- 1449 Briarlock Rd
- 1539 Ridge Creek Way
- 8240 Trafalgar Way