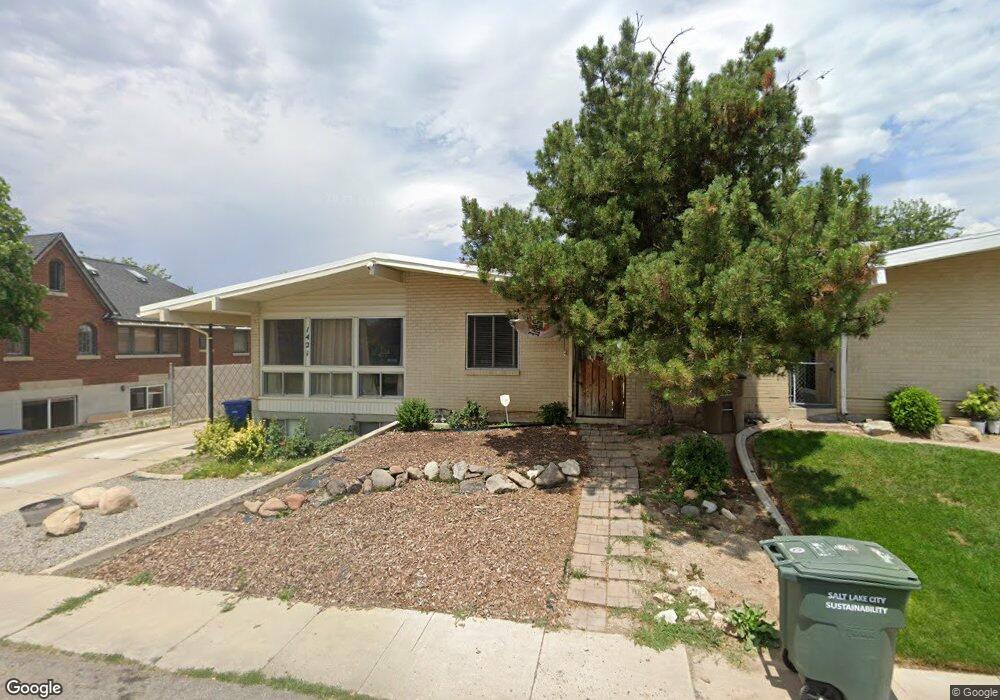
1419 E 3000 S Salt Lake City, UT 84106
Sugar House NeighborhoodEstimated Value: $736,003 - $843,000
7
Beds
5
Baths
3,528
Sq Ft
$225/Sq Ft
Est. Value
About This Home
This home is located at 1419 E 3000 S, Salt Lake City, UT 84106 and is currently estimated at $792,251, approximately $224 per square foot. 1419 E 3000 S is a home located in Salt Lake County with nearby schools including Highland Park Elementary School, Hillside Middle School, and Highland High School.
Ownership History
Date
Name
Owned For
Owner Type
Purchase Details
Closed on
Mar 15, 2018
Sold by
Petti Vj and Petti Larry
Bought by
Petti Vj and Petti Larry
Current Estimated Value
Home Financials for this Owner
Home Financials are based on the most recent Mortgage that was taken out on this home.
Original Mortgage
$184,000
Outstanding Balance
$155,831
Interest Rate
3.99%
Mortgage Type
Commercial
Estimated Equity
$636,420
Purchase Details
Closed on
Feb 11, 2018
Sold by
Little Water Properties Llc
Bought by
Petitt Petitt V and Petitt Larry
Home Financials for this Owner
Home Financials are based on the most recent Mortgage that was taken out on this home.
Original Mortgage
$184,000
Outstanding Balance
$155,831
Interest Rate
3.99%
Mortgage Type
Commercial
Estimated Equity
$636,420
Purchase Details
Closed on
Apr 30, 2012
Sold by
Carter H Craig and Carter Antoinette R
Bought by
Christensen Jeffrey R
Home Financials for this Owner
Home Financials are based on the most recent Mortgage that was taken out on this home.
Original Mortgage
$213,500
Interest Rate
3.94%
Mortgage Type
New Conventional
Purchase Details
Closed on
Dec 16, 2004
Sold by
Carter H Craig and Carter Antoinette R
Bought by
Carter H Craig and Carter Antoinette R
Home Financials for this Owner
Home Financials are based on the most recent Mortgage that was taken out on this home.
Original Mortgage
$192,815
Interest Rate
5.5%
Mortgage Type
Unknown
Purchase Details
Closed on
Jun 11, 2003
Sold by
Bowen Stanley A and Jones Laci D
Bought by
Jones Lacie D and Bowen Stanley A
Home Financials for this Owner
Home Financials are based on the most recent Mortgage that was taken out on this home.
Original Mortgage
$189,000
Interest Rate
5.61%
Mortgage Type
Unknown
Purchase Details
Closed on
Nov 16, 2001
Sold by
Jones Lacie D and Bowen Stanley A
Bought by
Bowen Stanley A and Jones Lacie D
Home Financials for this Owner
Home Financials are based on the most recent Mortgage that was taken out on this home.
Original Mortgage
$197,600
Interest Rate
6.62%
Purchase Details
Closed on
Dec 29, 1999
Sold by
Kesler Grant S
Bought by
Bowen Stanley A and Jones Lacie D
Home Financials for this Owner
Home Financials are based on the most recent Mortgage that was taken out on this home.
Original Mortgage
$174,300
Interest Rate
10.62%
Purchase Details
Closed on
Dec 17, 1998
Sold by
Kesler Mack S
Bought by
Kesler Mack S and Kesler Grant S
Create a Home Valuation Report for This Property
The Home Valuation Report is an in-depth analysis detailing your home's value as well as a comparison with similar homes in the area
Home Values in the Area
Average Home Value in this Area
Purchase History
| Date | Buyer | Sale Price | Title Company |
|---|---|---|---|
| Petti Vj | -- | Accommodation | |
| Petitt Petitt V | -- | Meridian Title | |
| Christensen Jeffrey R | -- | First American Title | |
| Carter H Craig | -- | Equity Title | |
| Carter H Craig | -- | Equity Title | |
| Jones Lacie D | -- | Inwest Title Services | |
| Bowen Stanley A | -- | Guardian Title Company | |
| Jones Lacie D | -- | Guardian Title Company | |
| Bowen Stanley A | -- | Title West | |
| Kesler Mack S | -- | -- | |
| Kesler Mack S | -- | -- |
Source: Public Records
Mortgage History
| Date | Status | Borrower | Loan Amount |
|---|---|---|---|
| Open | Petitt Petitt V | $184,000 | |
| Previous Owner | Christensen Jeffrey R | $213,500 | |
| Previous Owner | Carter H Craig | $192,815 | |
| Previous Owner | Jones Lacie D | $189,000 | |
| Previous Owner | Jones Lacie D | $197,600 | |
| Previous Owner | Bowen Stanley A | $174,300 | |
| Closed | Bowen Stanley A | $10,000 |
Source: Public Records
Tax History Compared to Growth
Tax History
| Year | Tax Paid | Tax Assessment Tax Assessment Total Assessment is a certain percentage of the fair market value that is determined by local assessors to be the total taxable value of land and additions on the property. | Land | Improvement |
|---|---|---|---|---|
| 2025 | $3,458 | $685,200 | $205,000 | $480,200 |
| 2024 | $3,458 | $659,800 | $198,700 | $461,100 |
| 2023 | $3,240 | $595,900 | $164,200 | $431,700 |
| 2022 | $3,539 | $610,700 | $161,000 | $449,700 |
| 2021 | $3,198 | $499,600 | $123,800 | $375,800 |
| 2020 | $3,072 | $456,800 | $113,500 | $343,300 |
| 2019 | $3,254 | $455,200 | $106,400 | $348,800 |
| 2018 | $2,874 | $391,500 | $106,400 | $285,100 |
| 2017 | $2,943 | $375,600 | $106,400 | $269,200 |
| 2016 | $2,654 | $321,700 | $106,400 | $215,300 |
| 2015 | $2,963 | $340,400 | $111,700 | $228,700 |
| 2014 | $2,839 | $323,600 | $109,600 | $214,000 |
Source: Public Records
Map
Nearby Homes
- 3026 S Crescent Dr
- 1371 E Zenith Ave
- 1582 E Zenith Ave
- 2865 S 1335 E
- 1314 E Crandall Ave
- 1621 E 3045 S
- 1411 Woodland Ave
- 1436 E Woodland Ave
- 2970 S Richmond St
- 3206 S Imperial St
- 2760 S Highland Dr Unit 21
- 2795 S Imperial St
- 1614 E 3300 S
- 1700 E 3300 S
- 1821 Bosham Ln S
- 1805 E 3170 S
- 3129 S 1810 E
- 1152 E 2700 S Unit S148
- 2710 S Highland Dr Unit 11
- 1192 E 2700 S
- 1421 E 3000 S
- 1429 E 3000 S
- 1415 E 3000 S
- 1439 E 3000 S
- 1426 Hudson Ave
- 1420 Hudson Ave
- 1420 E Hudson Ave
- 1430 Hudson Ave
- 2971 S 1400 E
- 1449 E 3000 S
- 2977 S 1400 E
- 2965 S 1400 E
- 1449 E 3010 S
- 1442 Hudson Ave
- 1412 E Hudson Ave
- 1442 E Hudson Ave
- 1412 Hudson Ave
- 1443 E 3010 S
- 1463 E 3010 S
- 1495 E 3000 S