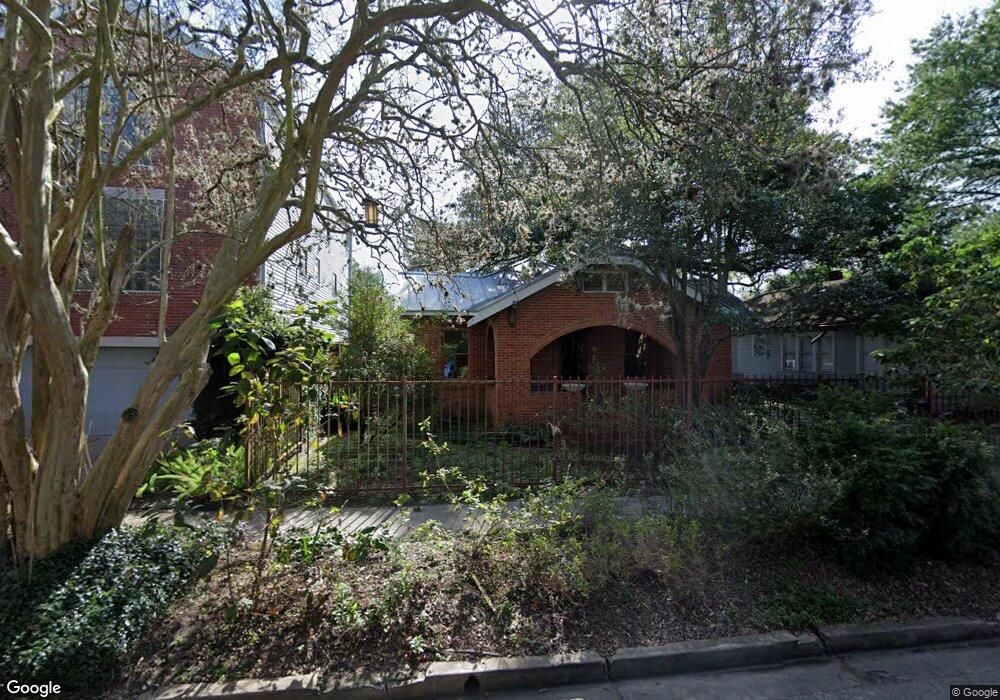
1419 Harold St Houston, TX 77006
Montrose NeighborhoodEstimated Value: $745,000
2
Beds
2
Baths
1,515
Sq Ft
$492/Sq Ft
Est. Value
About This Home
This home is located at 1419 Harold St, Houston, TX 77006 and is currently estimated at $745,000, approximately $491 per square foot. 1419 Harold St is a home located in Harris County with nearby schools including Baker Montessori, Lanier Middle School, and Lamar High School.
Ownership History
Date
Name
Owned For
Owner Type
Purchase Details
Closed on
Mar 9, 2009
Sold by
Cato Jan S
Bought by
Cato William Jackson
Current Estimated Value
Purchase Details
Closed on
Oct 17, 2006
Sold by
Tapley Charles
Bought by
Cato Jan S
Purchase Details
Closed on
Apr 22, 2002
Sold by
Mcmahen Monty L
Bought by
Tapley Charles
Purchase Details
Closed on
Dec 30, 1999
Sold by
Kratoville Joseph M and Patrick Marcia S
Bought by
Mcmahen Monty L
Home Financials for this Owner
Home Financials are based on the most recent Mortgage that was taken out on this home.
Original Mortgage
$169,300
Interest Rate
7.69%
Purchase Details
Closed on
Feb 26, 1996
Sold by
Jones Archie L and Slaughter Wayne
Bought by
Kratoville Joseph M and Patrick Marcia S
Create a Home Valuation Report for This Property
The Home Valuation Report is an in-depth analysis detailing your home's value as well as a comparison with similar homes in the area
Home Values in the Area
Average Home Value in this Area
Purchase History
| Date | Buyer | Sale Price | Title Company |
|---|---|---|---|
| Cato William Jackson | -- | Veritas Title | |
| Cato Jan S | -- | None Available | |
| Tapley Charles | -- | Charter Title Company | |
| Mcmahen Monty L | -- | American Title Co | |
| Kratoville Joseph M | -- | -- |
Source: Public Records
Mortgage History
| Date | Status | Borrower | Loan Amount |
|---|---|---|---|
| Previous Owner | Mcmahen Monty L | $169,300 | |
| Closed | Mcmahen Monty L | $10,550 |
Source: Public Records
Tax History Compared to Growth
Tax History
| Year | Tax Paid | Tax Assessment Tax Assessment Total Assessment is a certain percentage of the fair market value that is determined by local assessors to be the total taxable value of land and additions on the property. | Land | Improvement |
|---|---|---|---|---|
| 2025 | $4,669 | $837,944 | $714,000 | $123,944 |
| 2024 | $4,669 | $757,157 | $654,500 | $102,657 |
| 2023 | $4,669 | $766,772 | $654,500 | $112,272 |
| 2022 | $14,416 | $654,696 | $476,000 | $178,696 |
| 2021 | $14,145 | $606,913 | $476,000 | $130,913 |
| 2020 | $15,145 | $625,413 | $495,040 | $130,373 |
| 2019 | $14,570 | $575,775 | $495,040 | $80,735 |
| 2018 | $6,894 | $574,668 | $464,100 | $110,568 |
| 2017 | $15,166 | $574,668 | $464,100 | $110,568 |
| 2016 | $13,788 | $533,029 | $402,220 | $130,809 |
| 2015 | $6,095 | $477,485 | $402,220 | $75,265 |
| 2014 | $6,095 | $462,067 | $340,340 | $121,727 |
Source: Public Records
Map
Nearby Homes
- 1503 Harold St
- 1507 Kipling St
- 1511 Kipling St
- 1517 Kipling St
- 1510 Marshall St
- 3540 Yupon St
- 3515 Yupon St
- 1512 W Alabama St
- 1531 Marshall St Unit 3
- 3705 Mandell St Unit 8
- 3403 Yupon St
- 1612 Kipling St
- 1539 Westheimer Rd
- 1620 Harold St
- 1621 California St
- 1612 W Alabama St Unit ABCD
- 3311 Yupon St Unit 611
- 3311 Yupon St Unit 519
- 1634 Marshall St
- 1638 W Alabama St
- 1417 Harold St
- 1417 Harold St
- 1417 Harold St Unit B
- 1421 Harold St
- 1415 Harold St
- 1415 Harold St Unit 1/2
- 1423 Harold St
- 1422 Kipling St
- 1424 Kipling St
- 1420 Kipling St
- 1413 Harold St
- 1426 Kipling St
- 1418 Kipling St
- 1501 Harold St
- 1411 Harold St
- 1411 Harold St
- 1411 Harold St Unit B
- 1411 Harold St Unit A
- 1416 Kipling St
- 1414 Harold St