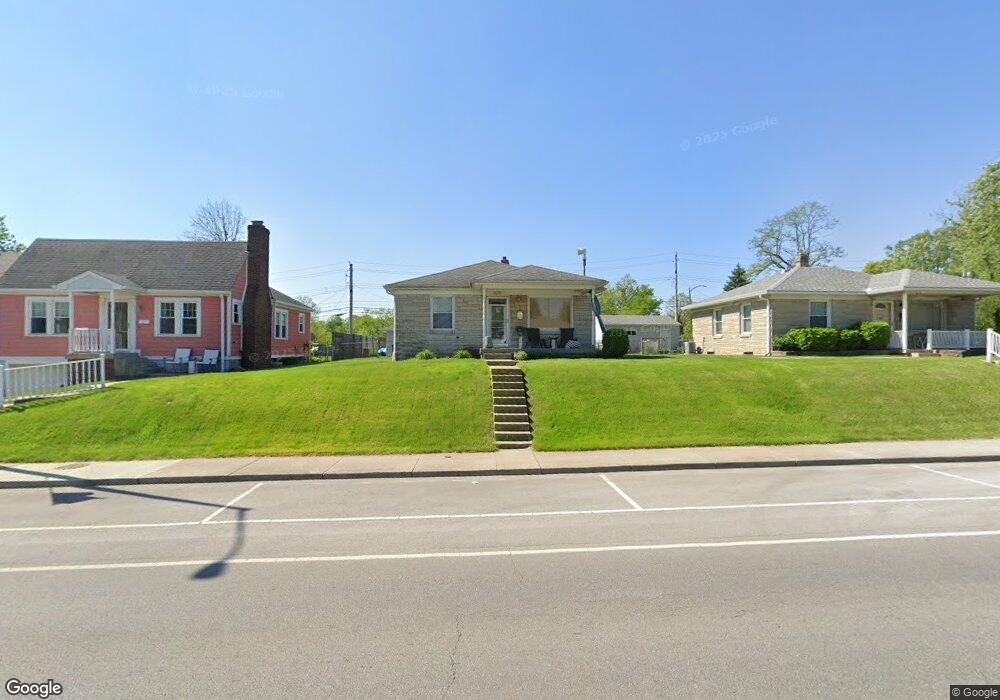
1419 Main St Beech Grove, IN 46107
Estimated Value: $163,000 - $213,851
2
Beds
2
Baths
1,780
Sq Ft
$105/Sq Ft
Est. Value
About This Home
This home is located at 1419 Main St, Beech Grove, IN 46107 and is currently estimated at $186,963, approximately $105 per square foot. 1419 Main St is a home located in Marion County with nearby schools including Hornet Park Elementary School, Central Elementary School, and South Grove Intermediate School.
Ownership History
Date
Name
Owned For
Owner Type
Purchase Details
Closed on
May 20, 2019
Sold by
Morgan John Michael
Bought by
Morgan John W and Morgan Sheri L
Current Estimated Value
Purchase Details
Closed on
Mar 8, 2012
Sold by
Klc Realty Llc
Bought by
Morgan John M and Morgan Sheri L
Purchase Details
Closed on
Oct 17, 2007
Sold by
Mason Daniel
Bought by
Rlc Realties Llc
Purchase Details
Closed on
Jun 27, 2007
Sold by
Mason Daniel
Bought by
Rlc Realties Llc
Create a Home Valuation Report for This Property
The Home Valuation Report is an in-depth analysis detailing your home's value as well as a comparison with similar homes in the area
Home Values in the Area
Average Home Value in this Area
Purchase History
| Date | Buyer | Sale Price | Title Company |
|---|---|---|---|
| Morgan John W | -- | None Available | |
| Morgan John Michael | -- | None Available | |
| Morgan John M | -- | None Available | |
| Rlc Realties Llc | $41,049 | None Available | |
| Rlc Realties Llc | $41,049 | None Available |
Source: Public Records
Tax History Compared to Growth
Tax History
| Year | Tax Paid | Tax Assessment Tax Assessment Total Assessment is a certain percentage of the fair market value that is determined by local assessors to be the total taxable value of land and additions on the property. | Land | Improvement |
|---|---|---|---|---|
| 2024 | $2,566 | $202,900 | $26,300 | $176,600 |
| 2023 | $2,566 | $189,600 | $26,300 | $163,300 |
| 2022 | $2,485 | $175,500 | $26,300 | $149,200 |
| 2021 | $2,005 | $148,700 | $26,300 | $122,400 |
| 2020 | $1,693 | $134,300 | $26,300 | $108,000 |
| 2019 | $1,336 | $111,600 | $21,700 | $89,900 |
| 2018 | $1,092 | $95,400 | $21,700 | $73,700 |
| 2017 | $1,088 | $93,100 | $21,700 | $71,400 |
| 2016 | $1,040 | $90,000 | $21,700 | $68,300 |
| 2014 | $917 | $83,300 | $21,700 | $61,600 |
| 2013 | $632 | $58,100 | $7,000 | $51,100 |
Source: Public Records
Map
Nearby Homes