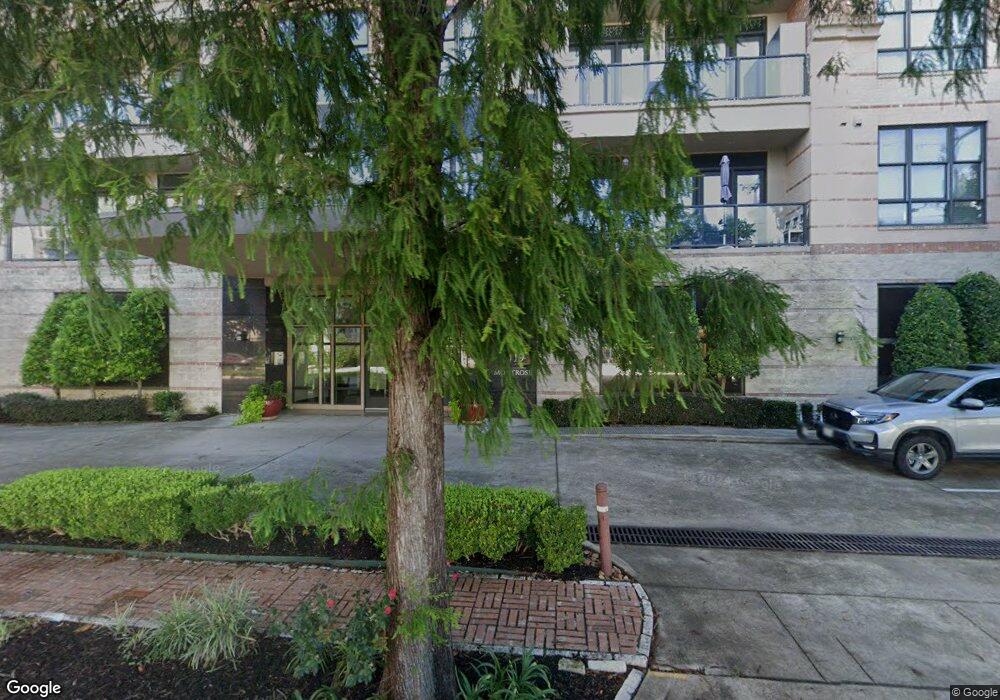
1419 Montrose Blvd Unit 702 Houston, TX 77019
Montrose NeighborhoodEstimated Value: $499,000 - $810,000
2
Beds
2
Baths
1,944
Sq Ft
$319/Sq Ft
Est. Value
About This Home
This home is located at 1419 Montrose Blvd Unit 702, Houston, TX 77019 and is currently estimated at $619,885, approximately $318 per square foot. 1419 Montrose Blvd Unit 702 is a home located in Harris County with nearby schools including Wharton Dual Language Academy, Gregory-Lincoln Ed Center, and Lamar High School.
Ownership History
Date
Name
Owned For
Owner Type
Purchase Details
Closed on
Mar 27, 2018
Sold by
Chafin Tim C and Broderick William C
Bought by
Smolik Interests Lp
Current Estimated Value
Purchase Details
Closed on
Aug 3, 2015
Sold by
Lawler William L and Lawler Carol M
Bought by
Chafin Tim C and Broderick William C
Home Financials for this Owner
Home Financials are based on the most recent Mortgage that was taken out on this home.
Original Mortgage
$428,000
Interest Rate
4.13%
Mortgage Type
New Conventional
Purchase Details
Closed on
Feb 29, 2008
Sold by
Roberts Marion Leland and Roberts Barbara Louise
Bought by
Lawler William L and Lawler Carol M
Home Financials for this Owner
Home Financials are based on the most recent Mortgage that was taken out on this home.
Original Mortgage
$417,000
Interest Rate
5.68%
Mortgage Type
Purchase Money Mortgage
Create a Home Valuation Report for This Property
The Home Valuation Report is an in-depth analysis detailing your home's value as well as a comparison with similar homes in the area
Home Values in the Area
Average Home Value in this Area
Purchase History
| Date | Buyer | Sale Price | Title Company |
|---|---|---|---|
| Smolik Interests Lp | -- | Old Republic National Title | |
| Chafin Tim C | -- | First American Title | |
| Lawler William L | -- | Charter Title Company |
Source: Public Records
Mortgage History
| Date | Status | Borrower | Loan Amount |
|---|---|---|---|
| Previous Owner | Chafin Tim C | $428,000 | |
| Previous Owner | Lawler William L | $417,000 |
Source: Public Records
Tax History Compared to Growth
Tax History
| Year | Tax Paid | Tax Assessment Tax Assessment Total Assessment is a certain percentage of the fair market value that is determined by local assessors to be the total taxable value of land and additions on the property. | Land | Improvement |
|---|---|---|---|---|
| 2025 | $13,571 | $632,199 | $120,118 | $512,081 |
| 2024 | $13,571 | $648,620 | $123,238 | $525,382 |
| 2023 | $13,571 | $648,620 | $123,238 | $525,382 |
| 2022 | $13,194 | $599,198 | $113,848 | $485,350 |
| 2021 | $13,965 | $599,198 | $113,848 | $485,350 |
| 2020 | $14,710 | $607,465 | $115,418 | $492,047 |
| 2019 | $15,372 | $607,465 | $115,418 | $492,047 |
| 2018 | $12,561 | $556,955 | $105,821 | $451,134 |
| 2017 | $14,779 | $556,955 | $105,821 | $451,134 |
| 2016 | $14,197 | $535,000 | $101,650 | $433,350 |
| 2015 | $14,354 | $642,729 | $122,119 | $520,610 |
| 2014 | $14,354 | $558,398 | $106,096 | $452,302 |
Source: Public Records
Map
Nearby Homes
- 1419 Montrose Blvd Unit 301
- 1128 W Pierce St
- 1222 Marconi St
- 1215 W Bell St
- 1215 W Pierce St
- 1014 Peden St Unit A
- 1014 Peden St Unit B
- 1116 Peden St
- 1220 W Gray St
- 1306 Crocker St
- 920 Peden St
- 1415 Crocker St
- 1210 Crocker St
- 1239 W Pierce St
- 909 Peden St
- 1203 Crocker St Unit B
- 1242 Peden St
- 1201 Bomar St
- 1016 Crocker St
- 1305 W Bell St
- 1419 Montrose Blvd Unit 504
- 1419 Montrose Blvd Unit 306
- 1419 Montrose Blvd Unit 505
- 1419 Montrose Blvd Unit 305
- 1419 Montrose Blvd Unit 406
- 1419 Montrose Blvd Unit 401
- 1419 Montrose Blvd Unit 404
- 1419 Montrose Blvd Unit 606
- 1419 Montrose Blvd Unit 403
- 1419 Montrose Blvd Unit 703
- 1419 Montrose Blvd Unit 701
- 1419 Montrose Blvd Unit 704
- 1419 Montrose Blvd Unit 605
- 1419 Montrose Blvd Unit 604
- 1419 Montrose Blvd Unit 603
- 1419 Montrose Blvd Unit 602
- 1419 Montrose Blvd Unit 601
- 1419 Montrose Blvd Unit 506
- 1419 Montrose Blvd Unit 503
- 1419 Montrose Blvd Unit 502