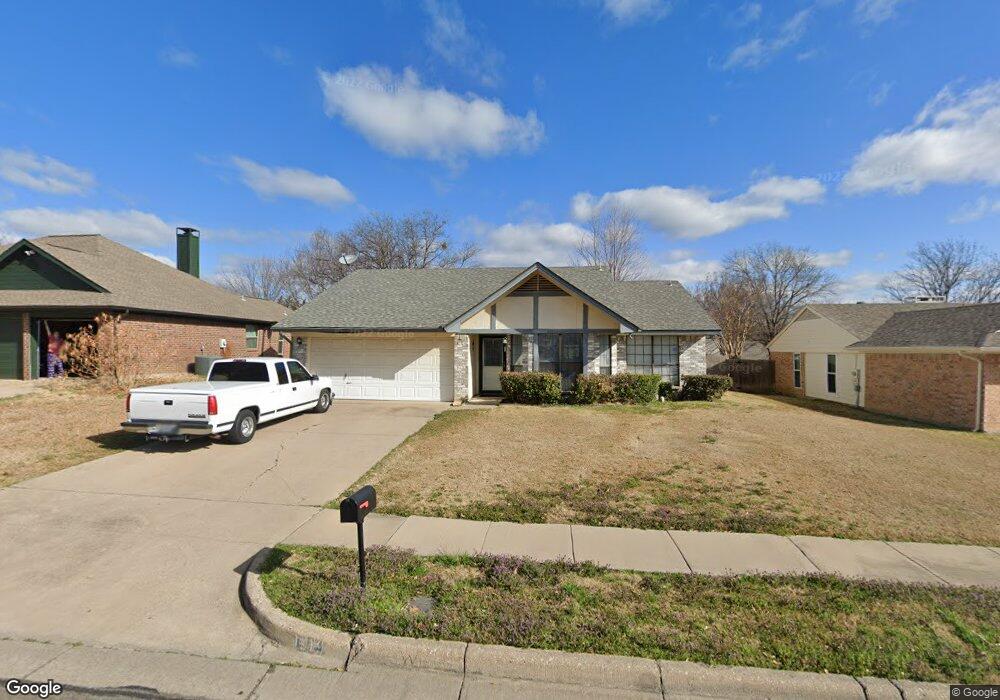
1419 Prentice St Arlington, TX 76018
Southeast Arlington NeighborhoodEstimated Value: $255,932 - $296,000
3
Beds
2
Baths
1,431
Sq Ft
$195/Sq Ft
Est. Value
About This Home
This home is located at 1419 Prentice St, Arlington, TX 76018 and is currently estimated at $279,733, approximately $195 per square foot. 1419 Prentice St is a home located in Tarrant County with nearby schools including Fitzgerald Elementary School, Ousley Jr. High School, and Bowie High School.
Ownership History
Date
Name
Owned For
Owner Type
Purchase Details
Closed on
Jul 10, 1998
Sold by
Heiman Rod
Bought by
Nyakundi Christopher M
Current Estimated Value
Home Financials for this Owner
Home Financials are based on the most recent Mortgage that was taken out on this home.
Original Mortgage
$3,674
Outstanding Balance
$758
Interest Rate
7.09%
Mortgage Type
Seller Take Back
Estimated Equity
$278,975
Purchase Details
Closed on
Dec 5, 1996
Sold by
Boroson David N
Bought by
Boroson Shirley
Home Financials for this Owner
Home Financials are based on the most recent Mortgage that was taken out on this home.
Original Mortgage
$70,739
Interest Rate
7.92%
Mortgage Type
Seller Take Back
Purchase Details
Closed on
Sep 13, 1996
Sold by
Crossman Andrew G and Crossman Kathy A
Bought by
Boroson Shirley and Boroson David N
Home Financials for this Owner
Home Financials are based on the most recent Mortgage that was taken out on this home.
Original Mortgage
$70,739
Interest Rate
7.9%
Mortgage Type
Seller Take Back
Create a Home Valuation Report for This Property
The Home Valuation Report is an in-depth analysis detailing your home's value as well as a comparison with similar homes in the area
Home Values in the Area
Average Home Value in this Area
Purchase History
| Date | Buyer | Sale Price | Title Company |
|---|---|---|---|
| Nyakundi Christopher M | -- | Commonwealth Land Title | |
| Heiman Rod | -- | Commonwealth Land Title | |
| Boroson Shirley | -- | -- | |
| Boroson Shirley | -- | Title Escrow |
Source: Public Records
Mortgage History
| Date | Status | Borrower | Loan Amount |
|---|---|---|---|
| Open | Heiman Rod | $3,674 | |
| Previous Owner | Boroson Shirley | $70,739 | |
| Previous Owner | Boroson Shirley | $70,739 |
Source: Public Records
Tax History
| Year | Tax Paid | Tax Assessment Tax Assessment Total Assessment is a certain percentage of the fair market value that is determined by local assessors to be the total taxable value of land and additions on the property. | Land | Improvement |
|---|---|---|---|---|
| 2025 | $5,835 | $266,979 | $64,476 | $202,503 |
| 2024 | $5,835 | $266,979 | $64,476 | $202,503 |
| 2023 | $5,750 | $260,565 | $40,000 | $220,565 |
| 2022 | $5,371 | $215,958 | $40,000 | $175,958 |
| 2021 | $4,988 | $191,980 | $40,000 | $151,980 |
| 2020 | $4,479 | $178,371 | $40,000 | $138,371 |
| 2019 | $4,662 | $179,452 | $40,000 | $139,452 |
| 2018 | $3,870 | $148,960 | $17,000 | $131,960 |
| 2017 | $3,610 | $135,644 | $17,000 | $118,644 |
| 2016 | $3,105 | $116,667 | $17,000 | $99,667 |
| 2015 | $2,353 | $89,200 | $17,000 | $72,200 |
| 2014 | $2,353 | $89,200 | $17,000 | $72,200 |
Source: Public Records
Map
Nearby Homes
- 5115 Nocona Ln
- 4950 Highbank Dr
- 4756 Hollow Tree Dr
- 1429 Spring Willow Dr
- 5326 Creek Valley Dr
- 5400 Creek Valley Dr
- 1415 Colonnade Dr
- 5502 Safari Trail
- 5505 Creek Valley Dr
- 5504 Creekridge Dr
- 1404 Colonnade Dr
- 4 Delano Dr
- 10 Delano Ct
- 11 Delano Ct
- 5 Delano Dr
- 2021 Green Oaks Blvd
- 5702 Streamside Dr
- 808 Wilmor Ct
- 5732 Chelmsford Trail
- 804 Castlewick Ct
- 1417 Prentice St
- 1501 Prentice St
- 1418 Seely St
- 1418 Seely St
- 1500 Seely St
- 1416 Seely St
- 1415 Prentice St
- 1503 Prentice St
- 1418 Prentice St
- 1502 Seely St
- 1416 Prentice St
- 1500 Prentice St
- 1414 Seely St
- 1411 Prentice St
- 1505 Prentice St
- 1414 Prentice St
- 1502 Prentice St
- 1504 Seely St
- 1410 Seely St
- 1410 Prentice St
Your Personal Tour Guide
Ask me questions while you tour the home.