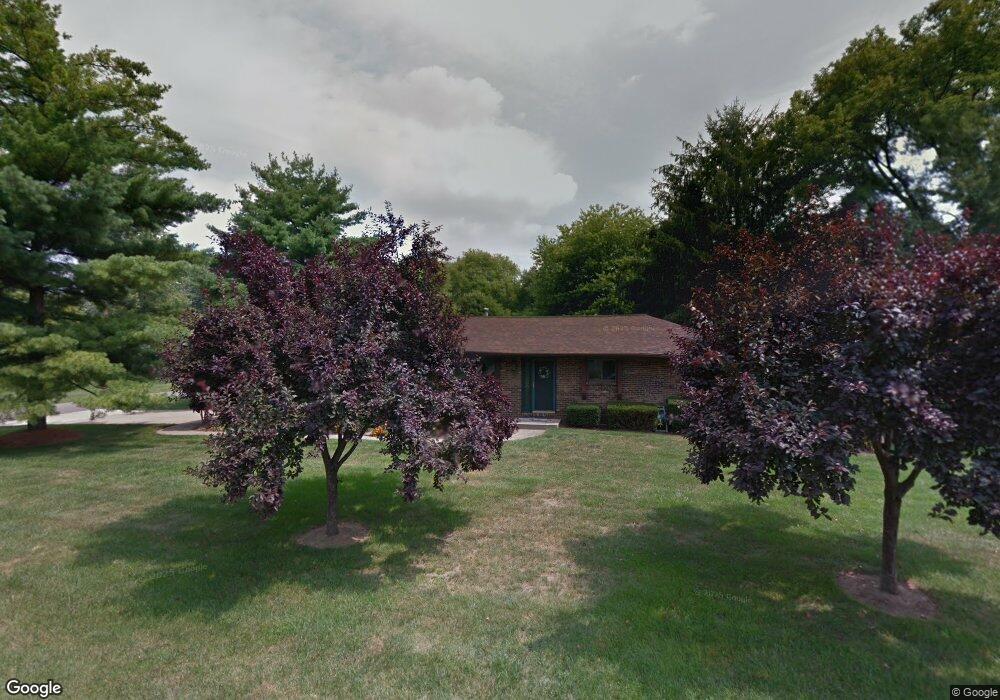
1419 Rancamp Ave Holland, OH 43528
Estimated Value: $209,000 - $260,000
3
Beds
3
Baths
1,706
Sq Ft
$137/Sq Ft
Est. Value
About This Home
This home is located at 1419 Rancamp Ave, Holland, OH 43528 and is currently estimated at $233,074, approximately $136 per square foot. 1419 Rancamp Ave is a home located in Lucas County with nearby schools including Crissey Elementary School, Springfield Middle School, and Springfield High School.
Ownership History
Date
Name
Owned For
Owner Type
Purchase Details
Closed on
Jul 30, 1996
Sold by
Welker William C
Bought by
Farmer Ronald J and Farmer Pamela M
Current Estimated Value
Home Financials for this Owner
Home Financials are based on the most recent Mortgage that was taken out on this home.
Original Mortgage
$91,700
Outstanding Balance
$7,391
Interest Rate
8.43%
Mortgage Type
New Conventional
Estimated Equity
$225,683
Purchase Details
Closed on
Jan 15, 1993
Sold by
Frazier Rodney L and Frazier Susan
Purchase Details
Closed on
Feb 22, 1989
Sold by
Nix C G and D G
Create a Home Valuation Report for This Property
The Home Valuation Report is an in-depth analysis detailing your home's value as well as a comparison with similar homes in the area
Home Values in the Area
Average Home Value in this Area
Purchase History
| Date | Buyer | Sale Price | Title Company |
|---|---|---|---|
| Farmer Ronald J | $122,535 | -- | |
| -- | $93,000 | -- | |
| -- | $85,000 | -- |
Source: Public Records
Mortgage History
| Date | Status | Borrower | Loan Amount |
|---|---|---|---|
| Open | Farmer Ronald J | $91,700 |
Source: Public Records
Tax History Compared to Growth
Tax History
| Year | Tax Paid | Tax Assessment Tax Assessment Total Assessment is a certain percentage of the fair market value that is determined by local assessors to be the total taxable value of land and additions on the property. | Land | Improvement |
|---|---|---|---|---|
| 2024 | $1,365 | $44,695 | $13,405 | $31,290 |
| 2023 | $3,134 | $45,080 | $7,490 | $37,590 |
| 2022 | $3,131 | $45,080 | $7,490 | $37,590 |
| 2021 | $2,944 | $45,080 | $7,490 | $37,590 |
| 2020 | $2,653 | $36,785 | $5,985 | $30,800 |
| 2019 | $2,592 | $36,785 | $5,985 | $30,800 |
| 2018 | $2,553 | $36,785 | $5,985 | $30,800 |
| 2017 | $2,219 | $29,295 | $8,750 | $20,545 |
| 2016 | $2,239 | $83,700 | $25,000 | $58,700 |
| 2015 | $2,235 | $83,700 | $25,000 | $58,700 |
| 2014 | $1,975 | $28,140 | $8,400 | $19,740 |
| 2013 | $1,975 | $28,140 | $8,400 | $19,740 |
Source: Public Records
Map
Nearby Homes
- 1421 Maumee St
- 1051 Wentworth St
- 1054 Clark St
- 7717 Angola Rd
- 7839 Airport Hwy
- 7139 Springfield Dr
- 7812 Harvest Gold Dr
- 8939 Airport Hwy
- 7813 Empire Ct
- 820 Weatherstone Rd
- 7331 Witherby Ct
- 1938 Huntley St
- 7882 Honey Crisp Ct
- 7822 Honey Crisp Ct
- 6666 Inglewood Rd
- 6505 Airport Hwy
- 7826 Gala Dr
- 7807 Gala Dr
- 2014 Inglewood Rd
- 6856 Morningdew Blvd