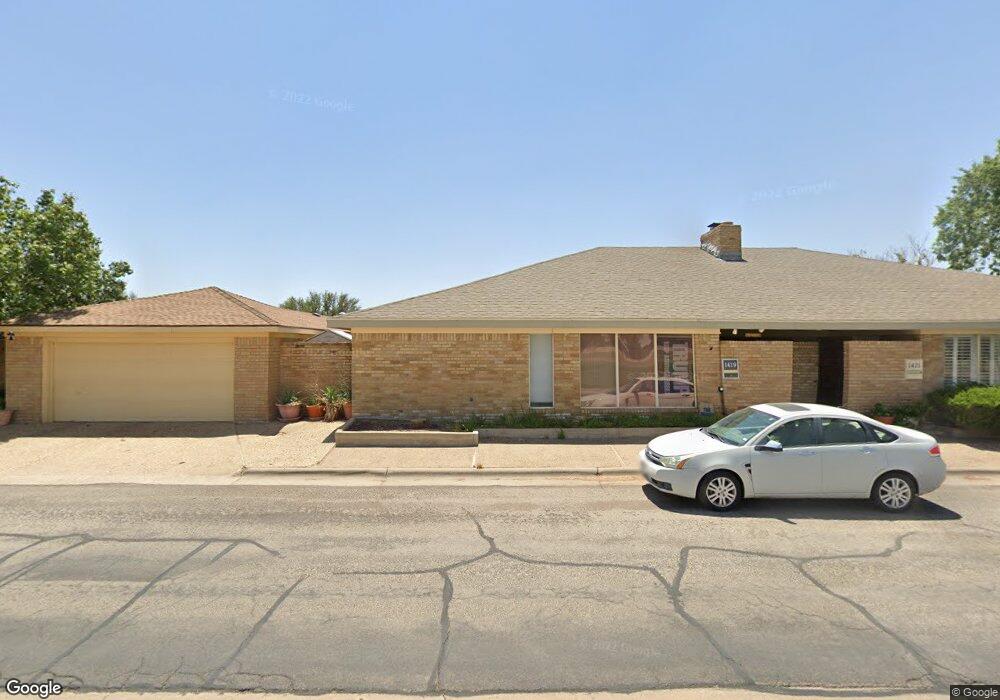
1419 Ventura Ave Midland, TX 79705
Estimated Value: $285,453 - $409,000
--
Bed
2
Baths
1,931
Sq Ft
$175/Sq Ft
Est. Value
About This Home
This home is located at 1419 Ventura Ave, Midland, TX 79705 and is currently estimated at $338,113, approximately $175 per square foot. 1419 Ventura Ave is a home located in Midland County with nearby schools including Fannin Elementary School, Midland High School, and Milam Elementary School.
Ownership History
Date
Name
Owned For
Owner Type
Purchase Details
Closed on
May 23, 2008
Sold by
Mckinney Michael Perry
Bought by
Banner Jane E and Banner Nicholas
Current Estimated Value
Home Financials for this Owner
Home Financials are based on the most recent Mortgage that was taken out on this home.
Original Mortgage
$69,222
Interest Rate
6.05%
Mortgage Type
Purchase Money Mortgage
Purchase Details
Closed on
Mar 1, 2001
Sold by
Yelverton Forest C
Bought by
Banner Nicholas P
Purchase Details
Closed on
Nov 16, 1999
Sold by
Hetrick Sandra Kay
Bought by
Banner Nicholas P
Purchase Details
Closed on
Feb 25, 1995
Bought by
Banner Nicholas P
Purchase Details
Closed on
Jun 1, 1990
Bought by
Banner Nicholas P
Purchase Details
Closed on
Aug 1, 1989
Bought by
Banner Nicholas P
Purchase Details
Closed on
Jan 25, 1980
Bought by
Banner Nicholas P
Create a Home Valuation Report for This Property
The Home Valuation Report is an in-depth analysis detailing your home's value as well as a comparison with similar homes in the area
Home Values in the Area
Average Home Value in this Area
Purchase History
| Date | Buyer | Sale Price | Title Company |
|---|---|---|---|
| Banner Jane E | -- | Lone Star Abstract & Title C | |
| Banner Nicholas P | -- | -- | |
| Banner Nicholas P | -- | -- | |
| Banner Nicholas P | -- | -- | |
| Banner Nicholas P | -- | -- | |
| Banner Nicholas P | -- | -- | |
| Banner Nicholas P | -- | -- |
Source: Public Records
Mortgage History
| Date | Status | Borrower | Loan Amount |
|---|---|---|---|
| Closed | Banner Jane E | $69,222 |
Source: Public Records
Tax History Compared to Growth
Tax History
| Year | Tax Paid | Tax Assessment Tax Assessment Total Assessment is a certain percentage of the fair market value that is determined by local assessors to be the total taxable value of land and additions on the property. | Land | Improvement |
|---|---|---|---|---|
| 2025 | $1,208 | $217,240 | $10,910 | $206,330 |
| 2024 | $1,212 | $222,030 | $10,910 | $211,120 |
| 2023 | $1,183 | $219,860 | $10,910 | $208,950 |
| 2022 | $3,484 | $223,000 | $10,910 | $212,090 |
| 2021 | $3,885 | $223,000 | $10,910 | $212,090 |
| 2020 | $2,099 | $216,150 | $10,910 | $205,240 |
| 2019 | $3,935 | $207,860 | $10,910 | $205,240 |
| 2018 | $3,674 | $188,960 | $10,910 | $178,050 |
| 2017 | $3,466 | $178,260 | $10,910 | $167,350 |
| 2016 | $3,282 | $176,500 | $10,910 | $165,590 |
| 2015 | -- | $176,500 | $10,910 | $165,590 |
| 2014 | -- | $176,000 | $10,910 | $165,090 |
Source: Public Records
Map
Nearby Homes
- 1209 W Pecan Ave
- 2202 Western Dr
- 2109 Western Dr
- 2105 Oaklawn Dr
- 1611 W Pecan Ave
- 907 Shirley Ct
- 2704 N L St
- 806 Stanolind Ave
- 2000 Neely Ave
- 2609 Mcclintic St
- 2016 Gulf Prairie Ln
- 2207 Raleigh Point Dr
- 1602 Winfield Rd
- 1200 W Scharbauer Dr
- 1202 W Scharbauer Dr
- 1210 W Scharbauer Dr
- 1606 Shell Ave
- 1805 N D St
- 2603 Hodges St
- 1000 Sinclair Ave
- 1421 Ventura Ave
- 1417 Ventura Ave
- 1423 Ventura Ave
- 1416 W Pine Ave
- 1414 W Pine Ave
- 1415 Ventura Ave
- 1418 W Pine Ave
- 1412 W Pine Ave
- 1425 Ventura Ave
- 1413 Ventura Ave
- 1420 W Pine Ave
- 1410 W Pine Ave
- 1411 W Pine Ave
- 1413 W Pine Ave
- 1427 Ventura Ave
- 1415 W Pine Ave
- 1409 W Pine Ave
- 1422 W Pine Ave
- 1411 Ventura Ave
- 1408 W Pine Ave