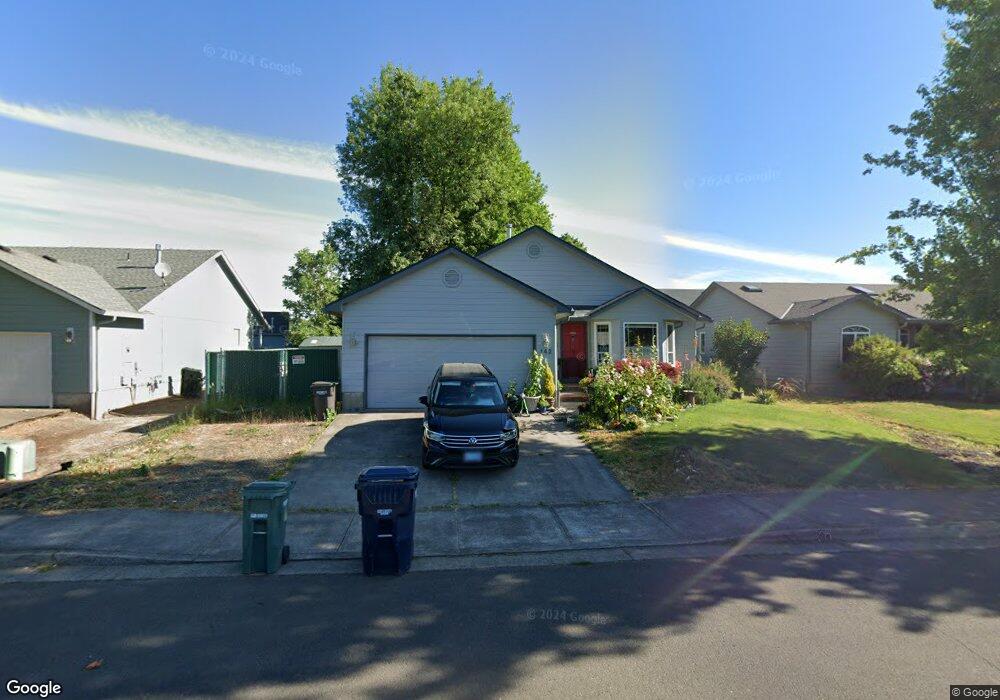
142 Ash Creek Dr E Monmouth, OR 97361
Estimated Value: $384,717 - $395,000
3
Beds
2
Baths
1,248
Sq Ft
$312/Sq Ft
Est. Value
About This Home
This home is located at 142 Ash Creek Dr E, Monmouth, OR 97361 and is currently estimated at $389,929, approximately $312 per square foot. 142 Ash Creek Dr E is a home located in Polk County with nearby schools including Monmouth Elementary School, Talmadge Middle School, and Central High School.
Ownership History
Date
Name
Owned For
Owner Type
Purchase Details
Closed on
Feb 8, 2006
Sold by
Hovenden Alisha M and Wilson Robert Ray
Bought by
Hanson Daniel N and Hanson Laurie M
Current Estimated Value
Home Financials for this Owner
Home Financials are based on the most recent Mortgage that was taken out on this home.
Original Mortgage
$118,000
Outstanding Balance
$66,272
Interest Rate
6.16%
Mortgage Type
Fannie Mae Freddie Mac
Estimated Equity
$323,657
Purchase Details
Closed on
Sep 20, 2004
Sold by
Gary Epping Construction Co Inc
Bought by
Hovenden Alisha M and Wilson Robert Ray
Home Financials for this Owner
Home Financials are based on the most recent Mortgage that was taken out on this home.
Original Mortgage
$115,400
Interest Rate
4.37%
Mortgage Type
Purchase Money Mortgage
Purchase Details
Closed on
Apr 12, 2004
Sold by
Sparks Brian E and Sparks Cheryl D
Bought by
Gary Epping Construction Co Inc
Create a Home Valuation Report for This Property
The Home Valuation Report is an in-depth analysis detailing your home's value as well as a comparison with similar homes in the area
Home Values in the Area
Average Home Value in this Area
Purchase History
| Date | Buyer | Sale Price | Title Company |
|---|---|---|---|
| Hanson Daniel N | $163,000 | Ticor Title | |
| Hovenden Alisha M | $144,250 | Fidelity Natl Title Co Of Or | |
| Gary Epping Construction Co Inc | $149,000 | Ticor Title |
Source: Public Records
Mortgage History
| Date | Status | Borrower | Loan Amount |
|---|---|---|---|
| Open | Hanson Daniel N | $118,000 | |
| Previous Owner | Hovenden Alisha M | $115,400 | |
| Closed | Hovenden Alisha M | $28,850 |
Source: Public Records
Tax History Compared to Growth
Tax History
| Year | Tax Paid | Tax Assessment Tax Assessment Total Assessment is a certain percentage of the fair market value that is determined by local assessors to be the total taxable value of land and additions on the property. | Land | Improvement |
|---|---|---|---|---|
| 2025 | $3,195 | $193,790 | $62,810 | $130,980 |
| 2024 | $3,195 | $188,150 | $60,980 | $127,170 |
| 2023 | $3,328 | $182,670 | $59,200 | $123,470 |
| 2022 | $2,995 | $177,350 | $57,470 | $119,880 |
| 2021 | $2,961 | $172,190 | $55,800 | $116,390 |
| 2020 | $2,843 | $167,180 | $54,170 | $113,010 |
| 2019 | $2,761 | $162,320 | $52,590 | $109,730 |
| 2018 | $2,666 | $157,600 | $51,060 | $106,540 |
| 2017 | $2,651 | $153,010 | $49,570 | $103,440 |
| 2016 | $2,709 | $148,560 | $48,120 | $100,440 |
| 2015 | $2,590 | $144,240 | $46,720 | $97,520 |
| 2014 | $2,532 | $140,040 | $45,360 | $94,680 |
Source: Public Records
Map
Nearby Homes
- 10042 Helmick Rd
- 10042/10044 Helmick Rd
- 545 Warren St S Unit 12
- 545 Warren St S
- 545 Warren St S Unit 7
- 460 Monmouth Ave S
- 0 S Pacific Hwy W Unit 1100+ 24617884
- 0 S Pacific Hwy W
- 505 Broad St S
- 412 Monmouth Ave S
- 13310 Monmouth Hwy
- 580 Walnut Ct S
- 271 Clay St E
- 297 Main St W
- 750 Beaton Ln
- 191 Catron St S
- 360 Main St W
- 348 Main St E
- 1176 Gwinn St E
- 858 Main St E
- 156 Ash Creek Dr E
- 138 Ash Creek Dr E
- 154 Ash Creek Dr E
- 149 Apple St
- 894 Warren St S
- 168 Ash Creek Dr E
- 894 Helmick Rd S
- 122 Ash Creek Dr E
- 871 Griffin Dr
- 174 Ash Creek Dr E
- 157 Apple St
- 870 Helmick Rd
- 110 Ash Creek Dr E
- 863 Griffin Dr
- 886 Helmick Rd
- 177 Apple St
- 186 Ash Creek Dr E
- 878 Helmick Rd
- 851 Griffin Dr