142 Colleton Dr Athens, GA 30606
Oak Bend NeighborhoodEstimated Value: $464,682 - $550,000
4
Beds
3
Baths
2,705
Sq Ft
$188/Sq Ft
Est. Value
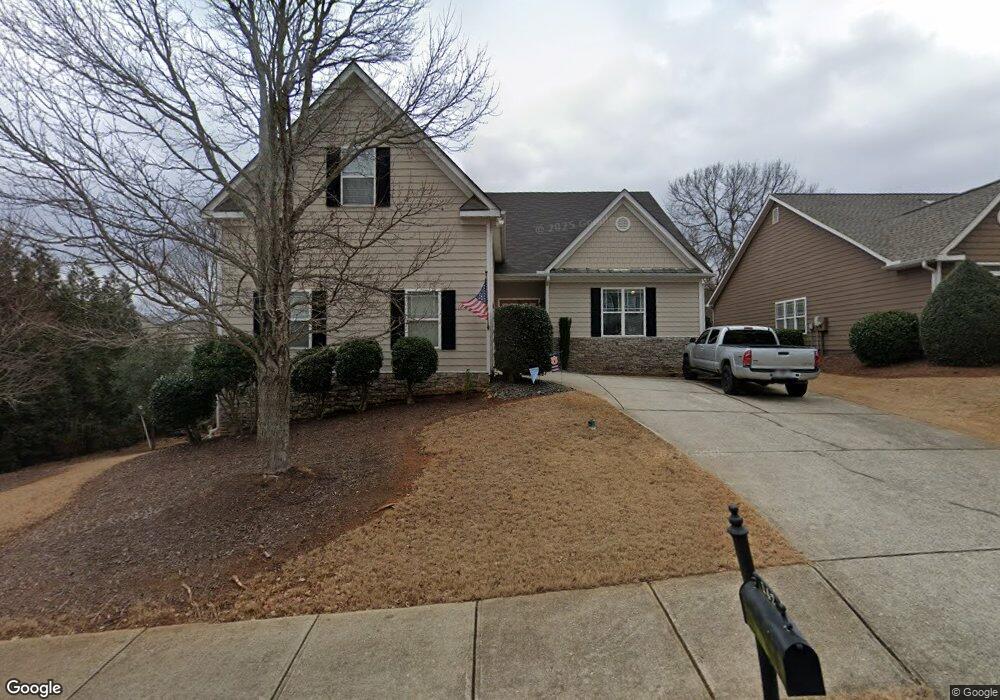
About This Home
This home is located at 142 Colleton Dr, Athens, GA 30606 and is currently estimated at $507,921, approximately $187 per square foot. 142 Colleton Dr is a home located in Clarke County with nearby schools including Timothy Elementary School, Clarke Middle School, and Clarke Central High School.
Ownership History
Date
Name
Owned For
Owner Type
Purchase Details
Closed on
Mar 14, 2024
Sold by
Bohnhoff Dovie H
Bought by
Bohnhoff Dovie Tr and Bohnhoff Alan Tr
Current Estimated Value
Purchase Details
Closed on
May 31, 2016
Sold by
Marshall Byron E
Bought by
Bohnfoff Dovie H and Bohnhoff Alan E
Home Financials for this Owner
Home Financials are based on the most recent Mortgage that was taken out on this home.
Original Mortgage
$225,000
Interest Rate
3.13%
Mortgage Type
New Conventional
Purchase Details
Closed on
Jan 4, 2007
Sold by
Not Provided
Bought by
Marshall Byron E and Walker Donna D
Home Financials for this Owner
Home Financials are based on the most recent Mortgage that was taken out on this home.
Original Mortgage
$213,200
Interest Rate
6.05%
Mortgage Type
New Conventional
Purchase Details
Closed on
Mar 24, 2004
Sold by
Timothy Road Partners Llc
Bought by
Colleton Oaks Llc
Create a Home Valuation Report for This Property
The Home Valuation Report is an in-depth analysis detailing your home's value as well as a comparison with similar homes in the area
Home Values in the Area
Average Home Value in this Area
Purchase History
| Date | Buyer | Sale Price | Title Company |
|---|---|---|---|
| Bohnhoff Dovie Tr | -- | -- | |
| Bohnfoff Dovie H | $250,000 | -- | |
| Marshall Byron E | $266,500 | -- | |
| Colleton Oaks Llc | $42,500 | -- |
Source: Public Records
Mortgage History
| Date | Status | Borrower | Loan Amount |
|---|---|---|---|
| Previous Owner | Bohnfoff Dovie H | $225,000 | |
| Previous Owner | Marshall Byron E | $213,200 | |
| Previous Owner | Marshall Byron E | $53,300 |
Source: Public Records
Tax History
| Year | Tax Paid | Tax Assessment Tax Assessment Total Assessment is a certain percentage of the fair market value that is determined by local assessors to be the total taxable value of land and additions on the property. | Land | Improvement |
|---|---|---|---|---|
| 2025 | $5,925 | $190,830 | $16,000 | $174,830 |
| 2024 | $5,925 | $183,734 | $16,000 | $167,734 |
| 2023 | $3,970 | $171,114 | $16,000 | $155,114 |
| 2022 | $3,711 | $141,125 | $16,000 | $125,125 |
| 2021 | $3,755 | $129,328 | $16,000 | $113,328 |
| 2020 | $3,573 | $116,035 | $12,000 | $104,035 |
| 2019 | $3,723 | $119,668 | $12,000 | $107,668 |
| 2018 | $3,652 | $117,570 | $12,000 | $105,570 |
| 2017 | $3,056 | $110,590 | $12,000 | $98,590 |
| 2016 | $3,189 | $103,918 | $12,000 | $91,918 |
| 2015 | $3,208 | $104,337 | $12,000 | $92,337 |
| 2014 | $2,840 | $93,374 | $12,000 | $81,374 |
Source: Public Records
Map
Nearby Homes
- 190 Kirkwood Dr
- 1705 Timothy Rd
- 114 Telfair Place
- 1845 Olympus Ct
- 1847 Olympus Ct
- 158 Mallard Pointe Way
- 125 Wood Lake Dr Unit 201
- 125 Wood Lake Dr Unit 302
- 173 Timothy Park Ln
- 245 Mallard Pointe Way
- 292 Wood Lake Dr
- 137 Timothy Park Ln
- 304 Wood Lake Dr
- 780 Kings Rd
- 196 Avalon Dr
- 232 Epps Bridge Rd Unit 1A
- 301 Skyline Pkwy
- 145 Heyward Allen Pkwy
- 157 Holly Hills Ct
- 155 Ridgeview Dr
Your Personal Tour Guide
Ask me questions while you tour the home.