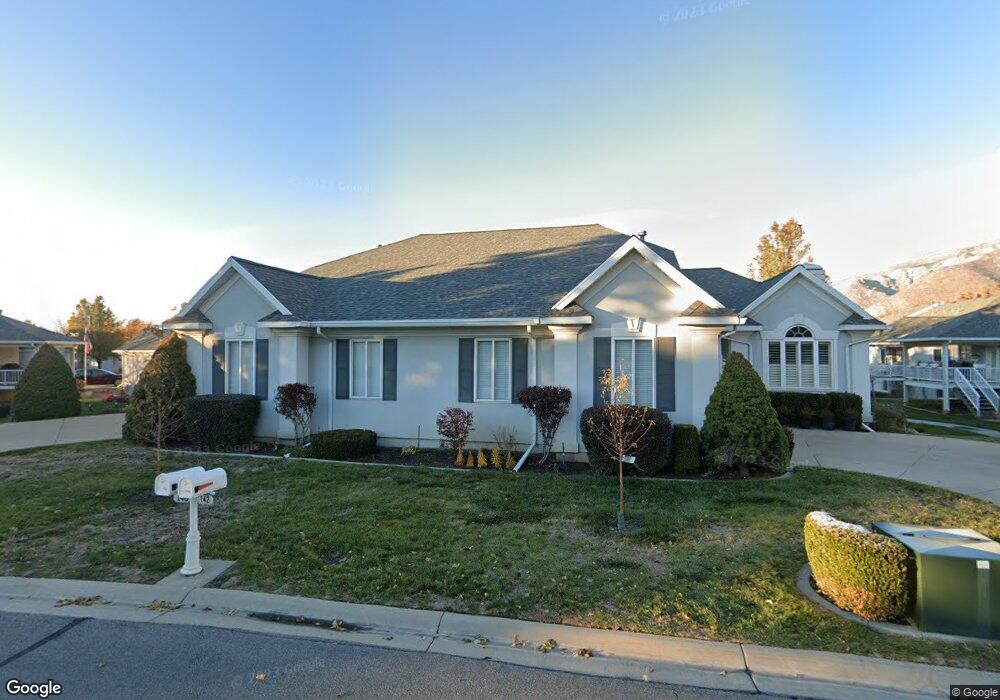
142 Country Springs Cir Bountiful, UT 84010
Estimated Value: $510,000 - $533,516
3
Beds
3
Baths
2,404
Sq Ft
$217/Sq Ft
Est. Value
About This Home
This home is located at 142 Country Springs Cir, Bountiful, UT 84010 and is currently estimated at $521,129, approximately $216 per square foot. 142 Country Springs Cir is a home located in Davis County with nearby schools including J A Taylor Elementary School, Centerville Jr High, and Viewmont High School.
Ownership History
Date
Name
Owned For
Owner Type
Purchase Details
Closed on
Feb 3, 2022
Sold by
Park Place Ii Lc
Bought by
142 Country Springs Llc
Current Estimated Value
Purchase Details
Closed on
Sep 24, 2021
Sold by
Christensen Val R and Christensen Ruth Ann
Bought by
Park Place Ii Lc
Purchase Details
Closed on
Jan 17, 2005
Sold by
Christensen Val R and Christensen Ruth Ann
Bought by
Christensen Val R and Christensen Ruth Ann
Purchase Details
Closed on
Dec 13, 2002
Sold by
Barlow L Richard
Bought by
Christensen Val R and Christensen Ruth Ann
Purchase Details
Closed on
Aug 30, 1996
Sold by
Barlow Lloyd J
Bought by
Barlow Loyd J
Purchase Details
Closed on
Aug 13, 1996
Sold by
Barlow Lloyd J
Bought by
Barlow Loyd J
Purchase Details
Closed on
Aug 5, 1996
Sold by
Mjm I Ltd Liability Company
Bought by
Barlow Lloyd J
Create a Home Valuation Report for This Property
The Home Valuation Report is an in-depth analysis detailing your home's value as well as a comparison with similar homes in the area
Home Values in the Area
Average Home Value in this Area
Purchase History
| Date | Buyer | Sale Price | Title Company |
|---|---|---|---|
| 142 Country Springs Llc | -- | None Listed On Document | |
| Park Place Ii Lc | -- | Cottonwood Title | |
| Christensen Val R | -- | -- | |
| Christensen Val R | -- | Western States Title Company | |
| Barlow Loyd J | -- | Western States Title Company | |
| Barlow Loyd J | -- | Legal Title Co | |
| Barlow Lloyd J | -- | Western States Title Company |
Source: Public Records
Tax History Compared to Growth
Tax History
| Year | Tax Paid | Tax Assessment Tax Assessment Total Assessment is a certain percentage of the fair market value that is determined by local assessors to be the total taxable value of land and additions on the property. | Land | Improvement |
|---|---|---|---|---|
| 2025 | $2,733 | $261,250 | $86,350 | $174,900 |
| 2024 | $2,638 | $256,850 | $62,150 | $194,700 |
| 2023 | $2,963 | $288,750 | $62,150 | $226,600 |
| 2022 | $2,753 | $485,000 | $104,000 | $381,000 |
| 2021 | $2,910 | $433,000 | $86,000 | $347,000 |
| 2020 | $2,724 | $409,000 | $55,600 | $353,400 |
| 2019 | $2,556 | $374,000 | $52,000 | $322,000 |
| 2018 | $2,437 | $366,000 | $54,000 | $312,000 |
| 2016 | $2,070 | $168,630 | $36,300 | $132,330 |
| 2015 | $2,063 | $158,950 | $36,300 | $122,650 |
| 2014 | $2,122 | $167,268 | $18,333 | $148,935 |
| 2013 | -- | $150,491 | $20,075 | $130,416 |
Source: Public Records
Map
Nearby Homes
- 204 Lyman Ln
- 234 Leah Cir
- 239 Lyman Ln
- 1552 N 200 W
- 420 Rawlins Cir
- 63 E 820 S
- 156 E 735 S Unit 24
- 967 S Courtyard Ln
- 1410 N 200 W
- 1503 N 300 W
- 353 Florentine Ln
- 548 S 675 W
- 235 W 1400 N
- 1260 N 200 W
- 29 W Lady Ln
- Lincoln Farmhouse Plan at Belmont Farms
- Belmont Traditional Plan at Belmont Farms
- Hampton Traditional Plan at Belmont Farms
- 324 S 600 W
- 1194 N 200 W
- 146 Country Springs Cir
- 1739 Country Springs Cir
- 1743 Country Springs Cir
- 1726 Country Springs Ln
- 1755 Country Springs Cir
- 1752 Country Springs Dr
- 1735 Country Springs Ln
- 139 Country Springs Cir
- 133 Country Springs Cir
- 1761 Country Springs Cir
- 1761 Country Springs Cir Unit 114
- 147 Country Springs Cir
- 1768 Country Springs Dr
- 149 Country Springs Cir
- 145 Country Springs Cir
- 135 Country Springs Cir
- 129 Country Springs Cir
- 131 Country Springs Cir
- 127 Country Springs Cir
- 1772 Country Springs Dr