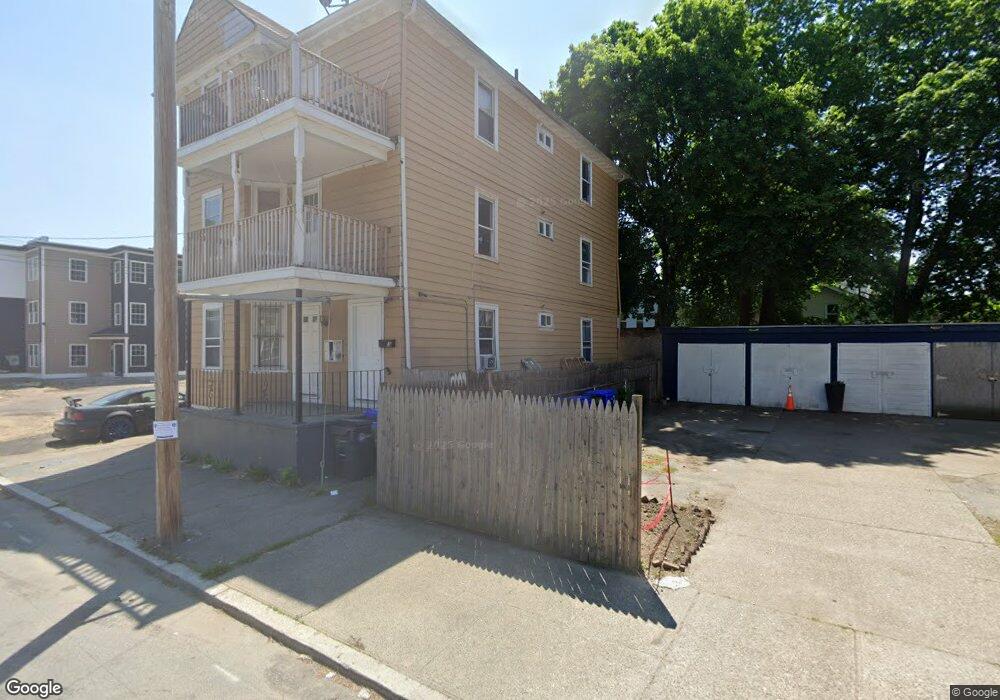
142 Gallup St Providence, RI 02905
Lower South Providence NeighborhoodEstimated Value: $596,000 - $617,000
6
Beds
4
Baths
3,309
Sq Ft
$184/Sq Ft
Est. Value
About This Home
This home is located at 142 Gallup St, Providence, RI 02905 and is currently estimated at $608,333, approximately $183 per square foot. 142 Gallup St is a home located in Providence County with nearby schools including Highlander Charter School and Bishop Mcvinney Elementary School.
Ownership History
Date
Name
Owned For
Owner Type
Purchase Details
Closed on
Jul 2, 2024
Sold by
Providence City Of
Bought by
Rose Realty & Family Invs
Current Estimated Value
Purchase Details
Closed on
Jul 7, 2023
Sold by
Providence City Of and Quezada
Bought by
Aj Properties Llc
Purchase Details
Closed on
Oct 12, 2021
Sold by
Providence City Of
Bought by
Aj Properties Llc
Purchase Details
Closed on
Sep 30, 2020
Sold by
Providence City Of
Bought by
Bogat Llc
Purchase Details
Closed on
Jul 8, 2019
Sold by
Providence City Of
Bought by
Ltrs Llc
Purchase Details
Closed on
May 7, 2012
Sold by
Providence City Of
Bought by
Quezada Carlos S
Purchase Details
Closed on
Dec 1, 2009
Sold by
First Horizon Home Loa
Bought by
Quezada Carlos S
Purchase Details
Closed on
Nov 12, 2008
Sold by
Diaz Prancisco
Bought by
First Horizon Home Loa
Create a Home Valuation Report for This Property
The Home Valuation Report is an in-depth analysis detailing your home's value as well as a comparison with similar homes in the area
Home Values in the Area
Average Home Value in this Area
Purchase History
| Date | Buyer | Sale Price | Title Company |
|---|---|---|---|
| Rose Realty & Family Invs | $7,291 | None Available | |
| Rose Realty & Family Invs | $7,291 | None Available | |
| Rose Realty & Family Invs | $7,291 | None Available | |
| Rose Realty & Family Invs | $7,291 | None Available | |
| Aj Properties Llc | $7,082 | None Available | |
| Aj Properties Llc | $7,082 | None Available | |
| Aj Properties Llc | $7,082 | None Available | |
| Aj Properties Llc | $7,082 | None Available | |
| Aj Properties Llc | $5,973 | None Available | |
| Aj Properties Llc | $5,973 | None Available | |
| Aj Properties Llc | $5,973 | None Available | |
| Aj Properties Llc | $5,973 | None Available | |
| Bogat Llc | $5,973 | None Available | |
| Bogat Llc | $5,973 | None Available | |
| Bogat Llc | $5,973 | None Available | |
| Bogat Llc | $5,973 | None Available | |
| Ltrs Llc | $5,200 | -- | |
| Ltrs Llc | $5,200 | -- | |
| Ltrs Llc | $5,200 | -- | |
| Quezada Carlos S | $4,080 | -- | |
| Quezada Carlos S | $4,080 | -- | |
| Quezada Carlos S | $55,125 | -- | |
| Quezada Carlos S | $55,125 | -- | |
| First Horizon Home Loa | $257,500 | -- | |
| First Horizon Home Loa | $257,500 | -- |
Source: Public Records
Mortgage History
| Date | Status | Borrower | Loan Amount |
|---|---|---|---|
| Previous Owner | First Horizon Home Loa | $80,000 | |
| Previous Owner | First Horizon Home Loa | $257,500 |
Source: Public Records
Tax History
| Year | Tax Paid | Tax Assessment Tax Assessment Total Assessment is a certain percentage of the fair market value that is determined by local assessors to be the total taxable value of land and additions on the property. | Land | Improvement |
|---|---|---|---|---|
| 2025 | $3,898 | $516,300 | $118,500 | $397,800 |
| 2024 | $6,268 | $341,600 | $75,100 | $266,500 |
| 2023 | $6,268 | $341,600 | $75,100 | $266,500 |
| 2022 | $6,080 | $341,600 | $75,100 | $266,500 |
| 2021 | $4,939 | $201,100 | $33,100 | $168,000 |
| 2020 | $4,939 | $201,100 | $33,100 | $168,000 |
| 2019 | $4,939 | $201,100 | $33,100 | $168,000 |
| 2018 | $4,385 | $137,200 | $30,100 | $107,100 |
| 2017 | $4,385 | $137,200 | $30,100 | $107,100 |
| 2016 | $4,385 | $137,200 | $30,100 | $107,100 |
| 2015 | $4,151 | $125,400 | $30,100 | $95,300 |
| 2014 | $4,232 | $125,400 | $30,100 | $95,300 |
| 2013 | $4,232 | $125,400 | $30,100 | $95,300 |
Source: Public Records
Map
Nearby Homes
Your Personal Tour Guide
Ask me questions while you tour the home.