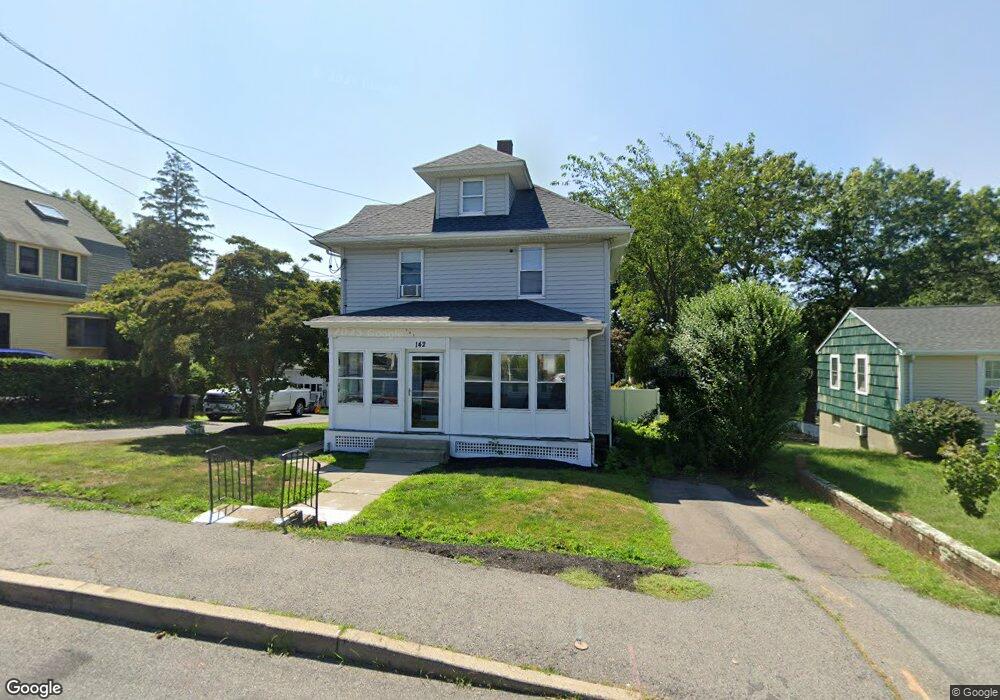
142 Hobart St Braintree, MA 02184
East Braintree NeighborhoodEstimated Value: $708,925 - $786,000
4
Beds
2
Baths
1,864
Sq Ft
$406/Sq Ft
Est. Value
About This Home
This home is located at 142 Hobart St, Braintree, MA 02184 and is currently estimated at $757,481, approximately $406 per square foot. 142 Hobart St is a home located in Norfolk County with nearby schools including Braintree High School, Sacred Heart Elementary School, and South Shore Christian Academy.
Ownership History
Date
Name
Owned For
Owner Type
Purchase Details
Closed on
Dec 13, 2017
Sold by
Wells Fargo Bank Na Tr
Bought by
Ocampo Emerson and Ocampo Dejea
Current Estimated Value
Home Financials for this Owner
Home Financials are based on the most recent Mortgage that was taken out on this home.
Original Mortgage
$444,180
Outstanding Balance
$371,942
Interest Rate
3.94%
Mortgage Type
FHA
Estimated Equity
$385,539
Purchase Details
Closed on
May 5, 2016
Sold by
Ocampo Alejandro and Wells Fargo Bank Na Tr
Bought by
Wells Fargo Bank Na Tr
Purchase Details
Closed on
Dec 21, 2006
Sold by
Ocampo Alejandro
Bought by
Ocampo Alejandro and Ocampo Emerson
Home Financials for this Owner
Home Financials are based on the most recent Mortgage that was taken out on this home.
Original Mortgage
$310,300
Interest Rate
6.36%
Mortgage Type
Purchase Money Mortgage
Purchase Details
Closed on
Nov 30, 2006
Sold by
Price Helen
Bought by
Ocampo Alejandro
Home Financials for this Owner
Home Financials are based on the most recent Mortgage that was taken out on this home.
Original Mortgage
$310,300
Interest Rate
6.36%
Mortgage Type
Purchase Money Mortgage
Create a Home Valuation Report for This Property
The Home Valuation Report is an in-depth analysis detailing your home's value as well as a comparison with similar homes in the area
Home Values in the Area
Average Home Value in this Area
Purchase History
We collect this data history from publicly available records. To have your information removed, we recommend requesting removal directly through your county’s website.
| Date | Buyer | Sale Price | Title Company |
|---|---|---|---|
| Ocampo Emerson | $445,000 | -- | |
| Wells Fargo Bank Na Tr | $255,875 | -- | |
| Ocampo Alejandro | -- | -- | |
| Ocampo Alejandro | -- | -- | |
| Ocampo Alejandro | $387,900 | -- |
Source: Public Records
Mortgage History
We collect this data history from publicly available records. To have your information removed, we recommend requesting removal directly through your county’s website.
| Date | Status | Borrower | Loan Amount |
|---|---|---|---|
| Open | Ocampo Emerson | $444,180 | |
| Previous Owner | Ocampo Alejandro | $310,300 |
Source: Public Records
Tax History
| Year | Tax Paid | Tax Assessment Tax Assessment Total Assessment is a certain percentage of the fair market value that is determined by local assessors to be the total taxable value of land and additions on the property. | Land | Improvement |
|---|---|---|---|---|
| 2025 | $6,795 | $680,900 | $346,900 | $334,000 |
| 2024 | $6,178 | $651,700 | $323,400 | $328,300 |
| 2023 | $5,819 | $596,200 | $290,600 | $305,600 |
| 2022 | $5,653 | $568,100 | $262,500 | $305,600 |
| 2021 | $5,401 | $542,800 | $237,200 | $305,600 |
| 2020 | $4,929 | $499,900 | $215,600 | $284,300 |
| 2019 | $4,631 | $459,000 | $206,300 | $252,700 |
| 2018 | $4,528 | $429,600 | $187,500 | $242,100 |
| 2017 | $4,268 | $397,400 | $178,100 | $219,300 |
| 2016 | $3,805 | $346,500 | $150,000 | $196,500 |
| 2015 | $3,815 | $344,600 | $148,100 | $196,500 |
| 2014 | $3,595 | $314,800 | $135,000 | $179,800 |
Source: Public Records
Map
Nearby Homes
- 25 Fairmount Ave
- 16 Cotton Ave
- 146 Hayward St
- 37 Tingley Rd
- 24 Hillside Ave
- 12 Marietta Ave
- 296 Commercial St Unit 21
- 302 Commercial St Unit 21
- 30 Skyline Dr Unit 6
- 37 Skyline Dr Unit 11
- 51 Faxon St
- 15 Devon Rd
- 37 Lantern Ln
- 25 W Howard St Unit G3
- 67 Trefton Dr
- 49 Brookside Rd
- 86 E Howard St Unit 107
- 200 Falls Blvd Unit B208
- 200 Falls Blvd Unit D110
- 115 Pilgrim Rd
Your Personal Tour Guide
Ask me questions while you tour the home.