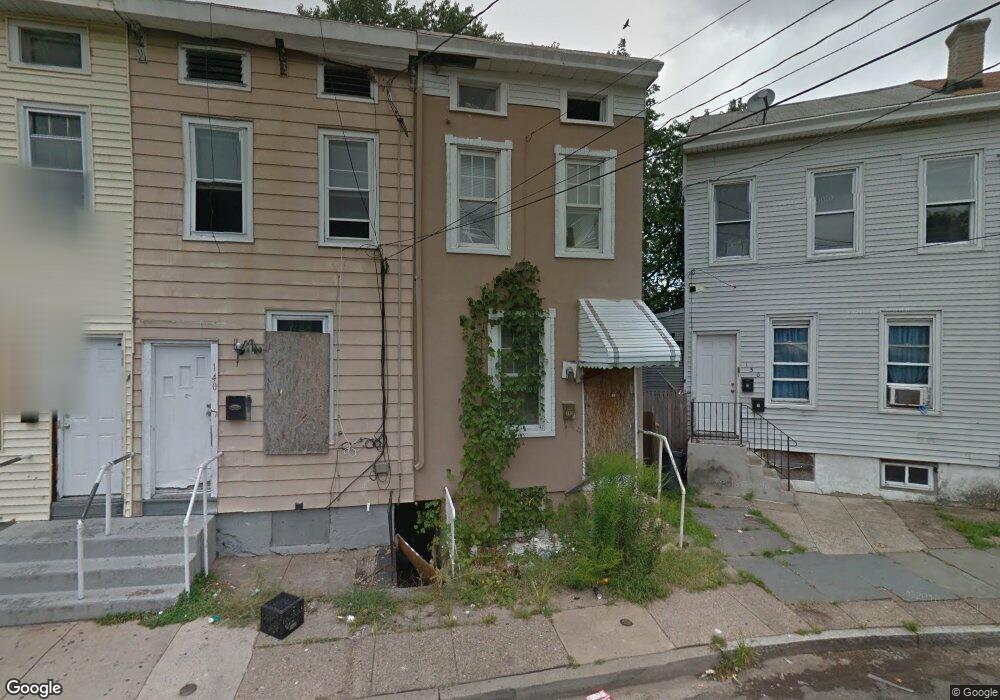
142 Home Ave Trenton, NJ 08611
South Trenton NeighborhoodEstimated Value: $122,890 - $190,000
2
Beds
1
Bath
759
Sq Ft
$205/Sq Ft
Est. Value
About This Home
This home is located at 142 Home Ave, Trenton, NJ 08611 and is currently estimated at $155,223, approximately $204 per square foot. 142 Home Ave is a home located in Mercer County with nearby schools including Mott Elementary School, Parker Elementary School, and Dr. Crosby Copeland Elementary School.
Ownership History
Date
Name
Owned For
Owner Type
Purchase Details
Closed on
Oct 26, 2018
Sold by
The City Of Trenton
Bought by
Quirmolue Herbert F
Current Estimated Value
Purchase Details
Closed on
Oct 22, 2018
Sold by
Quirmolue Herbert F
Bought by
Quirmolue Herbert F and Quirmolue Salonie A
Purchase Details
Closed on
Jun 8, 2004
Sold by
Colville Diane
Bought by
Garolis William
Home Financials for this Owner
Home Financials are based on the most recent Mortgage that was taken out on this home.
Original Mortgage
$52,200
Interest Rate
6.03%
Purchase Details
Closed on
Jun 6, 2002
Sold by
Piazza Michael
Bought by
Hanvey Diane
Home Financials for this Owner
Home Financials are based on the most recent Mortgage that was taken out on this home.
Original Mortgage
$35,100
Interest Rate
6.79%
Create a Home Valuation Report for This Property
The Home Valuation Report is an in-depth analysis detailing your home's value as well as a comparison with similar homes in the area
Home Values in the Area
Average Home Value in this Area
Purchase History
| Date | Buyer | Sale Price | Title Company |
|---|---|---|---|
| Quirmolue Herbert F | $70,001 | Fortune Title Agency Llc | |
| Quirmolue Herbert F | -- | Fortune Title Agency Inc | |
| Garolis William | $55,000 | -- | |
| Hanvey Diane | $39,000 | -- |
Source: Public Records
Mortgage History
| Date | Status | Borrower | Loan Amount |
|---|---|---|---|
| Previous Owner | Garolis William | $52,200 | |
| Previous Owner | Hanvey Diane | $35,100 |
Source: Public Records
Tax History Compared to Growth
Tax History
| Year | Tax Paid | Tax Assessment Tax Assessment Total Assessment is a certain percentage of the fair market value that is determined by local assessors to be the total taxable value of land and additions on the property. | Land | Improvement |
|---|---|---|---|---|
| 2025 | $754 | $42,100 | $8,400 | $33,700 |
| 2024 | $724 | $13,000 | $8,400 | $4,600 |
| 2023 | $724 | $13,000 | $8,400 | $4,600 |
| 2022 | $710 | $13,000 | $8,400 | $4,600 |
| 2021 | $722 | $13,000 | $8,400 | $4,600 |
| 2020 | $720 | $13,000 | $8,400 | $4,600 |
| 2019 | $708 | $13,000 | $8,400 | $4,600 |
| 2018 | $0 | $37,200 | $8,400 | $28,800 |
| 2017 | $1,843 | $37,200 | $8,400 | $28,800 |
| 2016 | $2,549 | $44,300 | $14,700 | $29,600 |
| 2015 | $2,540 | $44,300 | $14,700 | $29,600 |
| 2014 | $2,528 | $44,300 | $14,700 | $29,600 |
Source: Public Records
Map
Nearby Homes