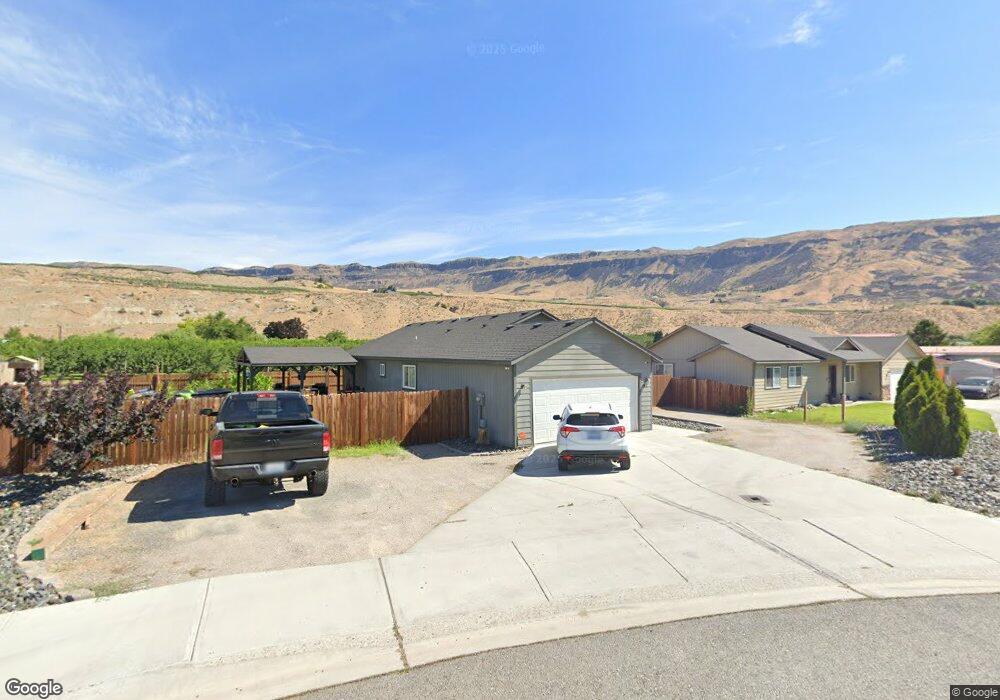
142 Island Loop Rock Island, WA 98850
Estimated Value: $409,000 - $477,000
3
Beds
2
Baths
1,388
Sq Ft
$321/Sq Ft
Est. Value
About This Home
This home is located at 142 Island Loop, Rock Island, WA 98850 and is currently estimated at $444,923, approximately $320 per square foot. 142 Island Loop is a home with nearby schools including Rock Island Elementary School, Clovis Point Intermediate School, and Eastmont Junior High School.
Ownership History
Date
Name
Owned For
Owner Type
Purchase Details
Closed on
Jul 28, 2016
Sold by
Cameo Vista Corp
Bought by
Bedolla Maria and Ontiveros Javier
Current Estimated Value
Home Financials for this Owner
Home Financials are based on the most recent Mortgage that was taken out on this home.
Original Mortgage
$197,359
Outstanding Balance
$159,422
Interest Rate
3.87%
Mortgage Type
FHA
Estimated Equity
$285,501
Create a Home Valuation Report for This Property
The Home Valuation Report is an in-depth analysis detailing your home's value as well as a comparison with similar homes in the area
Home Values in the Area
Average Home Value in this Area
Purchase History
| Date | Buyer | Sale Price | Title Company |
|---|---|---|---|
| Bedolla Maria | $201,000 | North Meridian Title & Escro |
Source: Public Records
Mortgage History
| Date | Status | Borrower | Loan Amount |
|---|---|---|---|
| Open | Bedolla Maria | $197,359 |
Source: Public Records
Tax History Compared to Growth
Tax History
| Year | Tax Paid | Tax Assessment Tax Assessment Total Assessment is a certain percentage of the fair market value that is determined by local assessors to be the total taxable value of land and additions on the property. | Land | Improvement |
|---|---|---|---|---|
| 2025 | $2,499 | $401,900 | $42,000 | $359,900 |
| 2024 | $2,499 | $302,900 | $42,000 | $260,900 |
| 2023 | $2,766 | $284,900 | $42,000 | $242,900 |
| 2022 | $2,898 | $284,900 | $42,000 | $242,900 |
| 2021 | $3,172 | $284,900 | $42,000 | $242,900 |
| 2020 | $2,222 | $284,900 | $42,000 | $242,900 |
| 2018 | $2,288 | $197,400 | $42,000 | $155,400 |
| 2017 | $2,089 | $197,400 | $42,000 | $155,400 |
| 2016 | $467 | $195,900 | $42,000 | $153,900 |
| 2015 | -- | $42,000 | $42,000 | $0 |
Source: Public Records
Map
Nearby Homes
- 1611 Douglas St
- 0 NNA Rock Island Dr
- 1511 Center St
- 7 Cambridge Ave
- 1366 Theo Way
- 1344 Theo Way
- 352 Hammond Ln
- 103 George Loop
- 95 Laurel Estates
- 6856 Batterman Rd
- 1114 Wells St
- 5060 Washington 28
- 1550 Pear Ln
- 44 Sageland
- 5097 Malaga Alcoa Hwy
- 583 S Webb Ave
- 559 S Webb Ave
- 539 S Webb Ave
- 0 Yote Rd
- 0 Ward St
- 138 Island Loop
- 146 Island Loop
- 134 Island Loop
- 135 Island Loop
- 135 Island Loop
- 150 Island Loop Rd
- 130 Island Loop
- 161 Island Loop Rd
- 113 Hanna Place
- 125 Island Loop
- 111 Hanna Place
- 124 Island Loop
- 158 Island Loop
- 169 Island Loop Rd
- 154 Island Loop Rd
- 162 Island Loop
- 158 Island Loop Rd
- 109 Hanna Place
- 118 Island Loop
- 177 Island Loop Rd