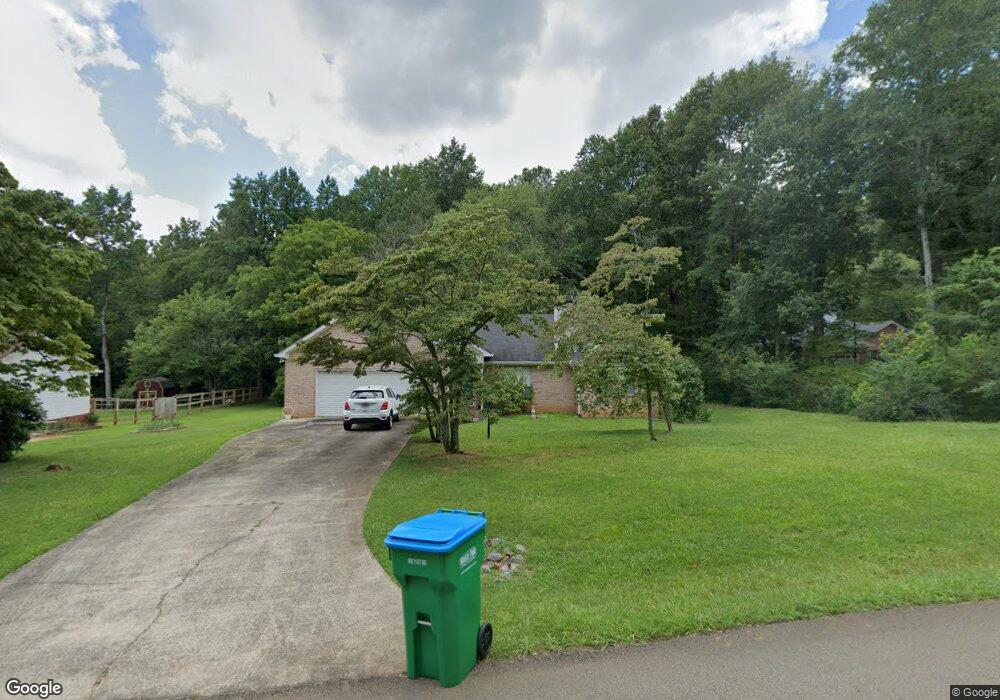
142 Keeble Creek Dr Jasper, GA 30143
Estimated Value: $315,721 - $381,000
3
Beds
2
Baths
1,648
Sq Ft
$215/Sq Ft
Est. Value
About This Home
This home is located at 142 Keeble Creek Dr, Jasper, GA 30143 and is currently estimated at $354,180, approximately $214 per square foot. 142 Keeble Creek Dr is a home located in Pickens County with nearby schools including Harmony Elementary School, Pickens County Middle School, and Pickens County High School.
Ownership History
Date
Name
Owned For
Owner Type
Purchase Details
Closed on
Aug 26, 2011
Sold by
Wright Latisha C
Bought by
Gibson Gerald
Current Estimated Value
Home Financials for this Owner
Home Financials are based on the most recent Mortgage that was taken out on this home.
Original Mortgage
$131,577
Outstanding Balance
$90,060
Interest Rate
4.25%
Mortgage Type
FHA
Estimated Equity
$264,120
Purchase Details
Closed on
Sep 29, 2005
Sold by
Miller Martha G
Bought by
Wright Latisha C
Home Financials for this Owner
Home Financials are based on the most recent Mortgage that was taken out on this home.
Original Mortgage
$130,000
Interest Rate
5.66%
Mortgage Type
New Conventional
Purchase Details
Closed on
Jan 24, 2004
Sold by
Garland Martin
Bought by
Miller Martha G
Purchase Details
Closed on
Mar 4, 1999
Sold by
Kown James T
Bought by
Garland Martin
Create a Home Valuation Report for This Property
The Home Valuation Report is an in-depth analysis detailing your home's value as well as a comparison with similar homes in the area
Home Values in the Area
Average Home Value in this Area
Purchase History
| Date | Buyer | Sale Price | Title Company |
|---|---|---|---|
| Gibson Gerald | $135,000 | -- | |
| Wright Latisha C | $162,500 | -- | |
| Wright Latisha C | $162,500 | -- | |
| Miller Martha G | $147,000 | -- | |
| Garland Martin | $120,000 | -- |
Source: Public Records
Mortgage History
| Date | Status | Borrower | Loan Amount |
|---|---|---|---|
| Open | Gibson Gerald | $131,577 | |
| Previous Owner | Wright Latisha C | $130,000 |
Source: Public Records
Tax History Compared to Growth
Tax History
| Year | Tax Paid | Tax Assessment Tax Assessment Total Assessment is a certain percentage of the fair market value that is determined by local assessors to be the total taxable value of land and additions on the property. | Land | Improvement |
|---|---|---|---|---|
| 2024 | $1,279 | $69,603 | $12,000 | $57,603 |
| 2023 | $1,314 | $69,603 | $12,000 | $57,603 |
| 2022 | $1,314 | $69,603 | $12,000 | $57,603 |
| 2021 | $1,408 | $69,603 | $12,000 | $57,603 |
| 2020 | $1,450 | $69,603 | $12,000 | $57,603 |
| 2019 | $1,330 | $62,946 | $12,000 | $50,946 |
| 2018 | $1,343 | $62,946 | $12,000 | $50,946 |
| 2017 | $1,365 | $62,946 | $12,000 | $50,946 |
| 2016 | $1,387 | $62,946 | $12,000 | $50,946 |
| 2015 | $1,354 | $62,946 | $12,000 | $50,946 |
| 2014 | $1,357 | $62,946 | $12,000 | $50,946 |
| 2013 | -- | $62,946 | $12,000 | $50,946 |
Source: Public Records
Map
Nearby Homes
- 85 Hampton Farms Trail
- 0 Liberty Ln Unit 10515868
- 405 Thrasher Ln
- 41 Clark Station Rd
- 75 Emerald Creek Dr
- 117 Cornett Ln S
- 71 Emerald Ln
- 3691 Hwy 515
- 304 Cornett Ln S
- 235 Mountain Blvd
- 125 Grand Cir
- 269 Grand Cir
- 155 Grand Cir
- The Maddux II Plan at Summit at Gateway
- The Ellison II Plan at Summit at Gateway
- The Norwood II Plan at Summit at Gateway
- 244 Town Creek Trail
- 275 Beth Ave
- 59 Brittany Ct
- 59 Brittany Ct Unit 8
- 160 Keeble Creek Dr
- 122 Keeble Creek Dr
- 0 Keeble Creek Dr Unit 9073927
- 0 Keeble Creek Dr Unit 8739827
- 0 Keeble Creek Dr Unit 8799882
- 0 Keeble Creek Dr Unit 3157654
- 0 Keeble Creek Dr Unit 7386825
- 0 Keeble Creek Dr Unit 7441228
- 0 Keeble Creek Dr Unit 8007062
- 0 Keeble Creek Dr Unit 8041072
- 0 Keeble Creek Dr Unit 8489536
- 0 Keeble Creek Dr Unit 8650202
- 0 Keeble Creek Dr Unit 8650173
- 0 Keeble Creek Dr
- 0 Keeble Creek Dr
- 178 Keeble Creek Dr
- 100 Keeble Creek Dr
- 139 Keeble Creek Dr
- 159 Keeble Creek Dr
- 212 Keeble Creek Dr