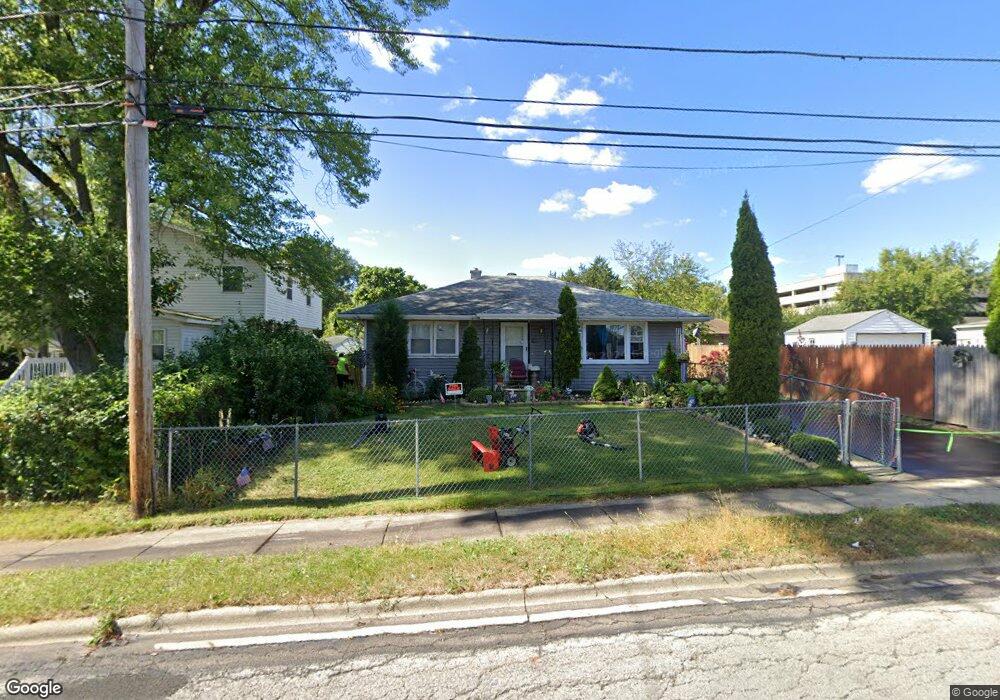
142 Keller Ave Waukegan, IL 60085
Hidden Glen NeighborhoodEstimated Value: $212,000 - $247,000
3
Beds
2
Baths
1,008
Sq Ft
$229/Sq Ft
Est. Value
About This Home
This home is located at 142 Keller Ave, Waukegan, IL 60085 and is currently estimated at $230,771, approximately $228 per square foot. 142 Keller Ave is a home located in Lake County with nearby schools including Washington Elementary School, Robert E. Abbott Middle School, and Waukegan High School.
Ownership History
Date
Name
Owned For
Owner Type
Purchase Details
Closed on
May 27, 2025
Sold by
Segura Manuel and Gomez Maria O
Bought by
Segura Manuel and Gomez Arnoldo
Current Estimated Value
Purchase Details
Closed on
May 7, 2003
Sold by
Gomez Maria O and Segura Lourdes
Bought by
Segura Manuel and Gomez Maria O
Purchase Details
Closed on
Aug 10, 2000
Sold by
Gonzalez Sandra and Segura Lourdes
Bought by
Gomez Maria O and Segura Lourdes
Home Financials for this Owner
Home Financials are based on the most recent Mortgage that was taken out on this home.
Original Mortgage
$116,000
Interest Rate
11.25%
Purchase Details
Closed on
Jul 24, 1996
Sold by
Bennett Michael J and Bennett Terri L
Bought by
Gonzalez Sandra and Segura Lourdes
Home Financials for this Owner
Home Financials are based on the most recent Mortgage that was taken out on this home.
Original Mortgage
$106,595
Interest Rate
8.43%
Mortgage Type
FHA
Create a Home Valuation Report for This Property
The Home Valuation Report is an in-depth analysis detailing your home's value as well as a comparison with similar homes in the area
Home Values in the Area
Average Home Value in this Area
Purchase History
| Date | Buyer | Sale Price | Title Company |
|---|---|---|---|
| Segura Manuel | -- | None Listed On Document | |
| Segura Manuel | -- | World Title | |
| Segura Manuel | -- | World Title | |
| Gomez Maria O | -- | Lawyers Title Pick Up | |
| Gonzalez Sandra | $109,000 | -- |
Source: Public Records
Mortgage History
| Date | Status | Borrower | Loan Amount |
|---|---|---|---|
| Previous Owner | Gomez Maria O | $116,000 | |
| Previous Owner | Gonzalez Sandra | $106,595 |
Source: Public Records
Tax History Compared to Growth
Tax History
| Year | Tax Paid | Tax Assessment Tax Assessment Total Assessment is a certain percentage of the fair market value that is determined by local assessors to be the total taxable value of land and additions on the property. | Land | Improvement |
|---|---|---|---|---|
| 2024 | $3,742 | $53,312 | $9,033 | $44,279 |
| 2023 | $3,691 | $47,688 | $8,080 | $39,608 |
| 2022 | $3,691 | $43,751 | $7,173 | $36,578 |
| 2021 | $3,191 | $36,607 | $6,170 | $30,437 |
| 2020 | $3,186 | $34,104 | $5,748 | $28,356 |
| 2019 | $3,154 | $31,251 | $5,267 | $25,984 |
| 2018 | $2,833 | $28,290 | $7,454 | $20,836 |
| 2017 | $2,707 | $25,029 | $6,595 | $18,434 |
| 2016 | $2,434 | $21,749 | $5,731 | $16,018 |
| 2015 | $2,275 | $19,465 | $5,129 | $14,336 |
| 2014 | $2,753 | $21,808 | $5,111 | $16,697 |
| 2012 | $3,632 | $23,628 | $5,538 | $18,090 |
Source: Public Records
Map
Nearby Homes
- 12601 W Atlantic Ave
- 2116 & 2101 Williamsburg Dr
- 2726 W Hidden Glen Dr
- 24 Washington Terrace
- 49 S Lewis Ave
- 102 Baldwin Ave
- 0 Brookside Ave
- 1521 Catalpa Ave
- 132 Dorchester Ct
- 3027 Belvidere Rd
- 2115 Lydia St
- 1416 Hamilton Ct
- 3170 W Monroe St Unit 309
- 671 Oldsmar Ln
- 615 Tiffany Dr
- 3159 Jeanette Ave
- 819 S Fulton Ave
- 446 S Jackson St
- 3298 7th St
- 1213 Grand Ave
- 138 Keller Ave
- 146 Keller Ave
- 134 Keller Ave
- 130 Keller Ave
- 143 Keller Ave
- 139 Keller Ave
- 2505 Melrose Ave
- 124 Keller Ave
- 147 Keller Ave
- 135 Keller Ave
- 2511 Melrose Ave
- 131 Keller Ave
- 201 Keller Ave
- 122 Keller Ave
- 2517 Melrose Ave
- 127 Keller Ave
- 205 Keller Ave
- 210 Keller Ave
- 2416 Melrose Ave
- 116 Keller Ave