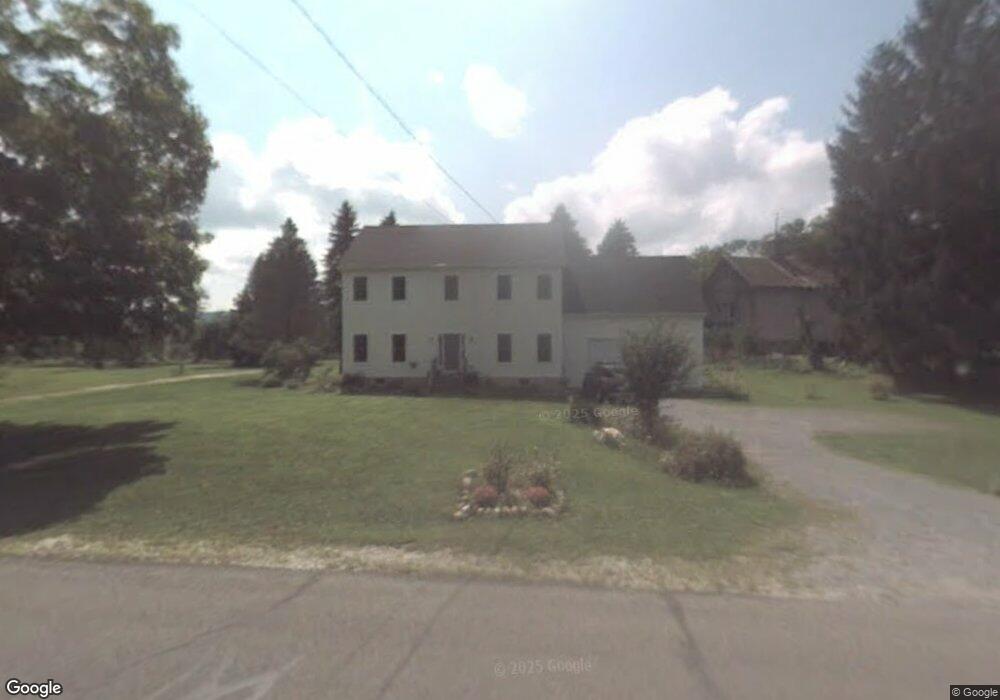
142 Main Rd Tyringham, MA 01264
Estimated Value: $530,000 - $1,404,000
3
Beds
3
Baths
2,240
Sq Ft
$365/Sq Ft
Est. Value
About This Home
This home is located at 142 Main Rd, Tyringham, MA 01264 and is currently estimated at $818,486, approximately $365 per square foot. 142 Main Rd is a home located in Berkshire County with nearby schools including Lee Elementary School and Lee Middle/High School.
Create a Home Valuation Report for This Property
The Home Valuation Report is an in-depth analysis detailing your home's value as well as a comparison with similar homes in the area
Tax History
We collect this data history from publicly available records. To have your information removed, we recommend requesting removal directly through your county’s website.
| Year | Tax Paid | Tax Assessment Tax Assessment Total Assessment is a certain percentage of the fair market value that is determined by local assessors to be the total taxable value of land and additions on the property. | Land | Improvement |
|---|---|---|---|---|
| 2025 | $2,737 | $447,200 | $55,000 | $392,200 |
| 2024 | $2,667 | $426,100 | $53,400 | $372,700 |
| 2023 | $2,723 | $413,800 | $51,000 | $362,800 |
| 2022 | $2,785 | $414,400 | $51,000 | $363,400 |
| 2021 | $2,789 | $404,200 | $49,600 | $354,600 |
| 2020 | $2,805 | $401,300 | $49,600 | $351,700 |
| 2019 | $2,683 | $399,800 | $49,600 | $350,200 |
| 2018 | $2,774 | $398,500 | $49,600 | $348,900 |
| 2017 | $2,750 | $392,900 | $48,600 | $344,300 |
| 2016 | $2,827 | $419,400 | $48,600 | $370,800 |
| 2015 | $2,719 | $408,300 | $48,600 | $359,700 |
Source: Public Records
Map
Nearby Homes
- 0 Goose Pond (Lot #4) Rd Unit 249638
- 37 Main Rd
- 26 Stonebridge Way
- 19 Lakeside Dr
- 8 Hemlock Rd
- 161 Beartown Mountain Rd
- 230 Chanterwood Rd
- 140 Beartown Mountain Rd
- 201 Chanterwood Rd
- 99 Beartown Mountain Rd
- 169 Mount Hunger Rd
- 545 Leisure Lee Rd
- Lot 15 Dimmock Rd
- 13 Hayes Pond Rd
- 0 Jacobs Ladder Rd Unit 249333
- 0 Jacobs Ladder Rd Unit 45
- 0 Jacobs Ladder Rd Unit 27595846
- 750 Stebbins Rd
- 43 Brook Ln
- 0 Dimmock Rd Unit 249928
Your Personal Tour Guide
Ask me questions while you tour the home.