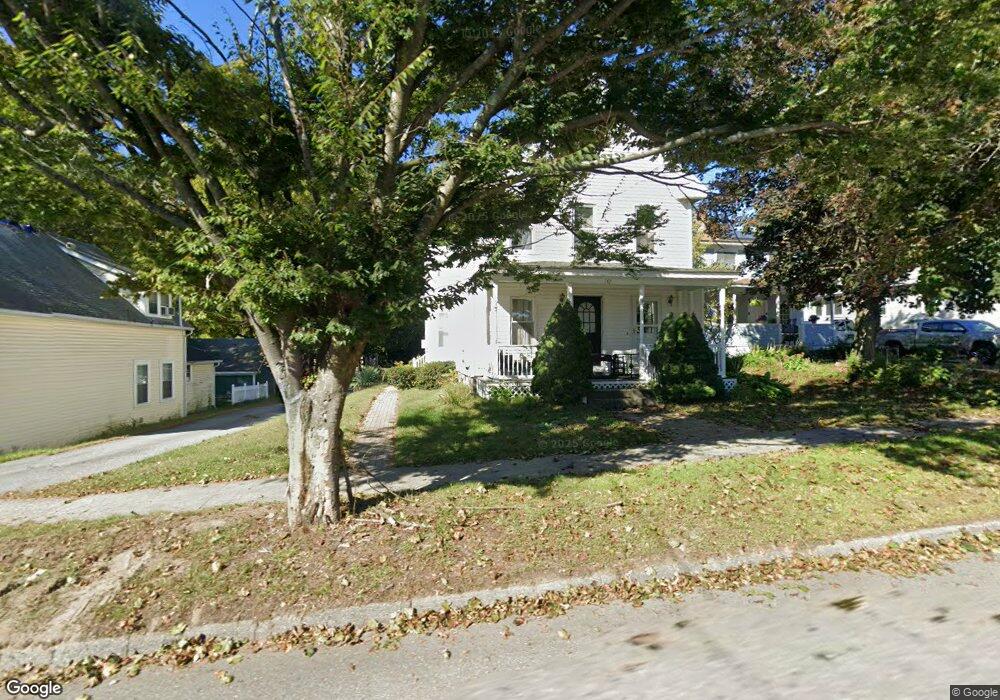
142 Main St Unit 2 Lancaster, MA 01523
Estimated Value: $496,000 - $628,000
3
Beds
1
Bath
1,100
Sq Ft
$493/Sq Ft
Est. Value
About This Home
This home is located at 142 Main St Unit 2, Lancaster, MA 01523 and is currently estimated at $542,738, approximately $493 per square foot. 142 Main St Unit 2 is a home located in Worcester County with nearby schools including Mary Rowlandson Elementary School, Luther Burbank Middle School, and Nashoba Regional High School.
Ownership History
Date
Name
Owned For
Owner Type
Purchase Details
Closed on
Jul 17, 2020
Sold by
Hus Kalen A
Bought by
Hus Kalen A
Current Estimated Value
Home Financials for this Owner
Home Financials are based on the most recent Mortgage that was taken out on this home.
Original Mortgage
$192,265
Outstanding Balance
$170,488
Interest Rate
3.1%
Mortgage Type
FHA
Estimated Equity
$372,250
Purchase Details
Closed on
Nov 3, 2003
Sold by
Laney Carol E
Bought by
Trott Selena D and Trott Timothy D
Home Financials for this Owner
Home Financials are based on the most recent Mortgage that was taken out on this home.
Original Mortgage
$170,000
Interest Rate
6.05%
Mortgage Type
Purchase Money Mortgage
Create a Home Valuation Report for This Property
The Home Valuation Report is an in-depth analysis detailing your home's value as well as a comparison with similar homes in the area
Home Values in the Area
Average Home Value in this Area
Purchase History
| Date | Buyer | Sale Price | Title Company |
|---|---|---|---|
| Hus Kalen A | -- | None Available | |
| Trott Selena D | $212,500 | -- |
Source: Public Records
Mortgage History
| Date | Status | Borrower | Loan Amount |
|---|---|---|---|
| Open | Hus Kalen A | $192,265 | |
| Previous Owner | Trott Selena D | $170,000 |
Source: Public Records
Tax History
| Year | Tax Paid | Tax Assessment Tax Assessment Total Assessment is a certain percentage of the fair market value that is determined by local assessors to be the total taxable value of land and additions on the property. | Land | Improvement |
|---|---|---|---|---|
| 2025 | $7,637 | $472,600 | $96,100 | $376,500 |
| 2024 | $6,504 | $372,500 | $87,400 | $285,100 |
| 2023 | $5,798 | $337,300 | $79,400 | $257,900 |
| 2022 | $5,880 | $302,300 | $74,300 | $228,000 |
| 2021 | $5,716 | $286,100 | $74,300 | $211,800 |
| 2020 | $4,415 | $222,400 | $74,400 | $148,000 |
| 2019 | $4,432 | $224,400 | $74,400 | $150,000 |
| 2018 | $4,488 | $224,600 | $74,400 | $150,200 |
| 2016 | $4,278 | $218,800 | $73,600 | $145,200 |
| 2015 | $4,122 | $219,700 | $73,600 | $146,100 |
| 2014 | $3,977 | $210,300 | $73,600 | $136,700 |
Source: Public Records
Map
Nearby Homes
- 76 Mill St Unit 3
- 132 Kilbourn Rd
- 73 Prescott St
- 0 Parker Rd
- 861 Main St
- 508 High St
- 12 Woodruff Rd
- 93 Forest St
- 46 Woodruff Rd
- 5 Catherine St
- 54 S Meadow Rd
- 719 Main St
- 101 Woodruff Rd
- 57 Clark St
- 37 Sterling St
- 920 Ridgefield Cir Unit C
- 20 Willow St
- 18 Highfield Dr
- 55 Sterling St Unit 306
- 55 Sterling St Unit 312
Your Personal Tour Guide
Ask me questions while you tour the home.