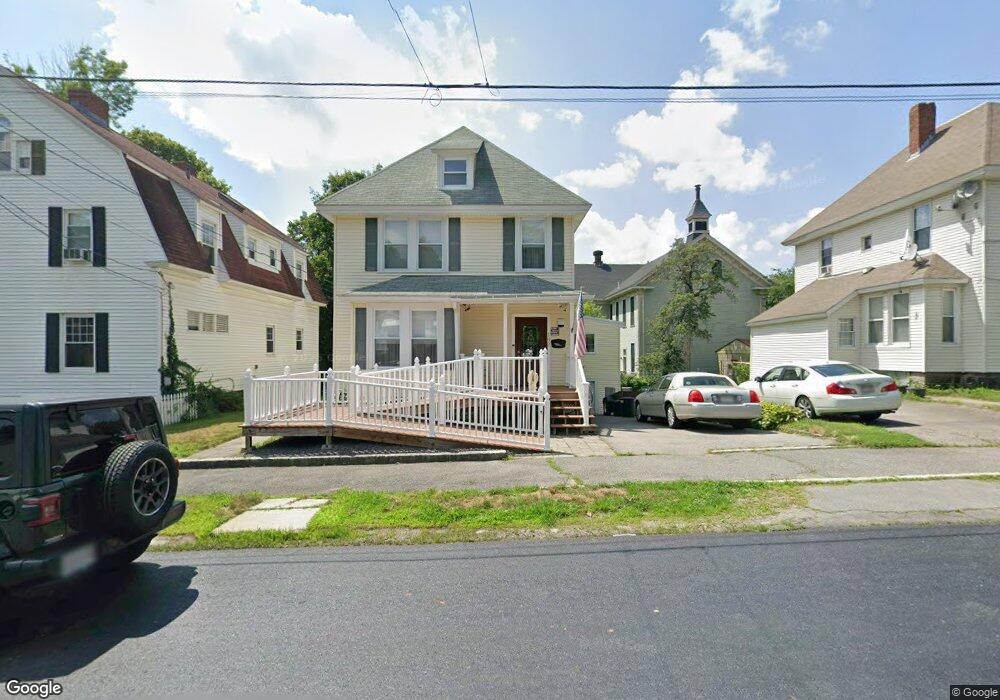
142 Myrtle St Lowell, MA 01850
Centralville NeighborhoodEstimated Value: $440,000 - $604,000
4
Beds
2
Baths
2,963
Sq Ft
$184/Sq Ft
Est. Value
About This Home
This home is located at 142 Myrtle St, Lowell, MA 01850 and is currently estimated at $545,848, approximately $184 per square foot. 142 Myrtle St is a home located in Middlesex County with nearby schools including S. Christa McAuliffe Elementary School, Greenhalge Elementary School, and Moody Elementary School.
Ownership History
Date
Name
Owned For
Owner Type
Purchase Details
Closed on
Apr 28, 2000
Sold by
Berard Robert G
Bought by
Jordan James M and Jordan Michelle P
Current Estimated Value
Purchase Details
Closed on
May 17, 1996
Sold by
Marchand Russell and Marchand Maureen
Bought by
Berard Robert
Create a Home Valuation Report for This Property
The Home Valuation Report is an in-depth analysis detailing your home's value as well as a comparison with similar homes in the area
Home Values in the Area
Average Home Value in this Area
Purchase History
| Date | Buyer | Sale Price | Title Company |
|---|---|---|---|
| Jordan James M | $128,000 | -- | |
| Jordan James M | $128,000 | -- | |
| Berard Robert | $84,000 | -- | |
| Berard Robert | $84,000 | -- |
Source: Public Records
Mortgage History
| Date | Status | Borrower | Loan Amount |
|---|---|---|---|
| Open | Berard Robert | $20,000 | |
| Open | Berard Robert | $198,000 |
Source: Public Records
Tax History
| Year | Tax Paid | Tax Assessment Tax Assessment Total Assessment is a certain percentage of the fair market value that is determined by local assessors to be the total taxable value of land and additions on the property. | Land | Improvement |
|---|---|---|---|---|
| 2025 | $6,440 | $561,000 | $134,500 | $426,500 |
| 2024 | $6,284 | $527,600 | $125,700 | $401,900 |
| 2023 | $5,950 | $479,100 | $109,300 | $369,800 |
| 2022 | $5,785 | $455,900 | $99,400 | $356,500 |
| 2021 | $5,403 | $401,400 | $86,400 | $315,000 |
| 2020 | $5,005 | $374,600 | $75,500 | $299,100 |
| 2019 | $4,908 | $349,600 | $69,900 | $279,700 |
| 2018 | $4,799 | $333,500 | $66,600 | $266,900 |
| 2017 | $4,549 | $304,900 | $60,500 | $244,400 |
| 2016 | $4,283 | $282,500 | $59,000 | $223,500 |
| 2015 | $4,115 | $265,800 | $59,000 | $206,800 |
| 2013 | $3,695 | $246,200 | $69,000 | $177,200 |
Source: Public Records
Map
Nearby Homes
- 106 Methuen St Unit B
- 18 May St
- 27-29 Fifth St
- 105 3rd St
- 25 Read St
- 45 W 4th St
- 94 1st St Unit 10
- Lot 11 Christian St
- Lot 12 Christian St
- Lot 9 Christian St
- Lot 10 Christian St
- 118 W 6th St
- 3 Vernon St
- 81 Reservoir St
- Lots 1-12 Christian Hill Dev
- 35 Whitney Ave Unit 33
- 52 Christian St
- 42 Christian St
- 27 Bunker Hill Ave
- 23 18th St
Your Personal Tour Guide
Ask me questions while you tour the home.