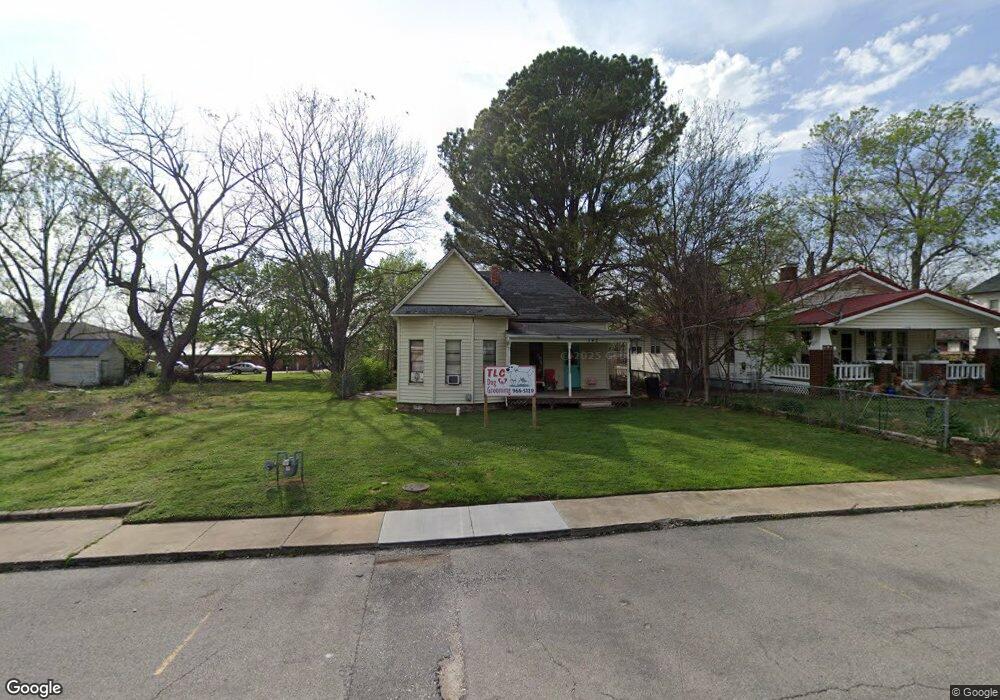
142 N Mock St Prairie Grove, AR 72753
Estimated Value: $152,000 - $225,000
2
Beds
1
Bath
916
Sq Ft
$199/Sq Ft
Est. Value
About This Home
This home is located at 142 N Mock St, Prairie Grove, AR 72753 and is currently estimated at $181,838, approximately $198 per square foot. 142 N Mock St is a home located in Washington County with nearby schools including Prairie Grove Elementary School, Prairie Grove Middle School, and Prairie Grove Junior High School.
Ownership History
Date
Name
Owned For
Owner Type
Purchase Details
Closed on
Aug 5, 2003
Sold by
Pierson Christina Lynn
Bought by
Nall Charles Michael and Nall Kitty Lynn
Current Estimated Value
Home Financials for this Owner
Home Financials are based on the most recent Mortgage that was taken out on this home.
Original Mortgage
$48,500
Interest Rate
5.24%
Mortgage Type
Purchase Money Mortgage
Purchase Details
Closed on
Jun 19, 1996
Bought by
Pierson Christina Lynne
Purchase Details
Closed on
Jan 21, 1994
Bought by
Moore Lee F
Purchase Details
Closed on
Jun 26, 1986
Bought by
Bond Steven R and Bond Beverly A
Purchase Details
Closed on
Oct 29, 1985
Bought by
Administrator Of Veteran Affairs
Purchase Details
Closed on
Aug 14, 1985
Bought by
First Commercial Mtg Co
Create a Home Valuation Report for This Property
The Home Valuation Report is an in-depth analysis detailing your home's value as well as a comparison with similar homes in the area
Home Values in the Area
Average Home Value in this Area
Purchase History
| Date | Buyer | Sale Price | Title Company |
|---|---|---|---|
| Nall Charles Michael | $49,000 | Landtrust Title & Closing | |
| Pierson Christina Lynne | $42,000 | -- | |
| Moore Lee F | $24,000 | -- | |
| Bond Steven R | -- | -- | |
| Administrator Of Veteran Affairs | -- | -- | |
| First Commercial Mtg Co | $22,000 | -- |
Source: Public Records
Mortgage History
| Date | Status | Borrower | Loan Amount |
|---|---|---|---|
| Closed | Nall Charles Michael | $48,500 |
Source: Public Records
Tax History Compared to Growth
Tax History
| Year | Tax Paid | Tax Assessment Tax Assessment Total Assessment is a certain percentage of the fair market value that is determined by local assessors to be the total taxable value of land and additions on the property. | Land | Improvement |
|---|---|---|---|---|
| 2025 | $767 | $23,190 | $11,900 | $11,290 |
| 2024 | $720 | $23,190 | $11,900 | $11,290 |
| 2023 | $685 | $23,190 | $11,900 | $11,290 |
| 2022 | $623 | $13,640 | $4,900 | $8,740 |
| 2021 | $575 | $13,640 | $4,900 | $8,740 |
| 2020 | $525 | $13,640 | $4,900 | $8,740 |
| 2019 | $483 | $8,870 | $3,400 | $5,470 |
| 2018 | $483 | $8,870 | $3,400 | $5,470 |
| 2017 | $478 | $8,870 | $3,400 | $5,470 |
| 2016 | $478 | $8,870 | $3,400 | $5,470 |
| 2015 | $478 | $8,870 | $3,400 | $5,470 |
| 2014 | $549 | $10,190 | $3,400 | $6,790 |
Source: Public Records
Map
Nearby Homes
- 4.66 +/- AC Tract 5 Hwy 62 & S Mock St
- TBD Kate Smith St
- 208 N Neal St
- Lot 2 Holmes St
- 201 E Cleveland St
- 106 S Ozark St
- 204 Armstrong St
- 303 E Center St
- 107 S Ozark St
- 201 E Douglas St
- 0 Douglas St Unit 1293623
- 710 Marcella St
- 606 1/2 E Buchanan St
- 608 Catlett St
- 901 E Buchanan St
- 881 E Buchanan St
- 680 Marcella St
- 304 S Summit St
- 211 Boston St
- 308 S Summit St
- 146 N Mock St
- 138 N Mock St
- 154 N Mock St
- 147 Kate Smith St
- 139 Kate Smith St
- 153 Kate Smith St
- 162 N Mock St
- 107 W Parks St
- 119 Kate Smith St
- 111 W Parks St
- 163 N Mock St
- 0 Mock T 2
- 0 Mock T 3
- 0 Mock T 4
- 207 N Mock St
- 211 N Mock St
- 5.06 AC Barbwire Wc 3629 Rd
- 3,4,26,27,54 Charismatic Dr
- 0 Clinton Wc 3217 Unit 1060507
- 709 Central