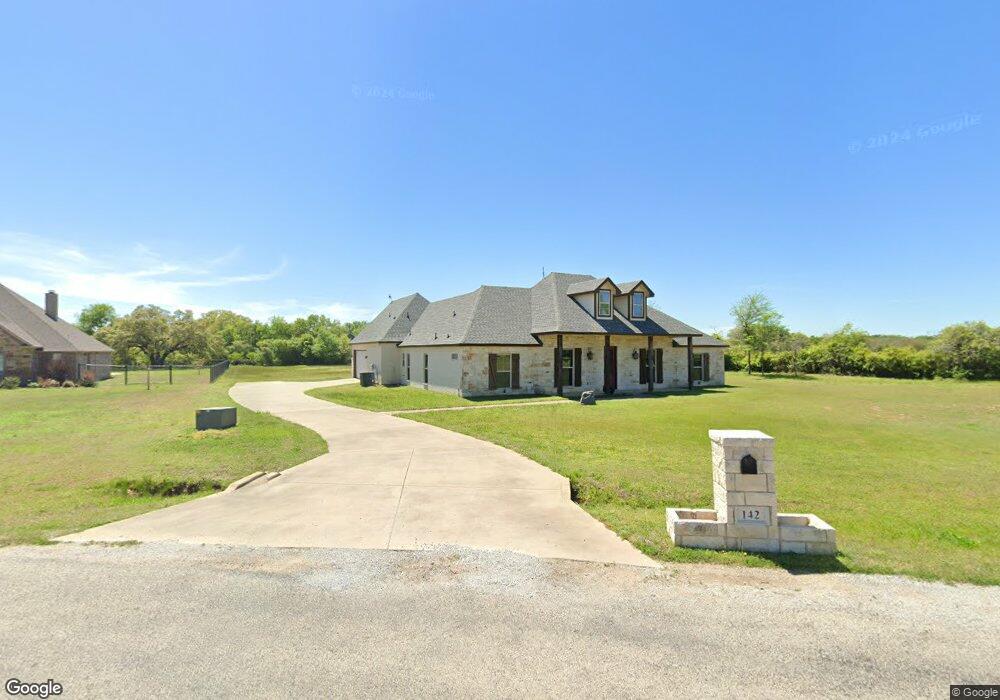
142 Oakwood Creek Ln Weatherford, TX 76088
Estimated Value: $508,000 - $560,000
--
Bed
3
Baths
2,298
Sq Ft
$235/Sq Ft
Est. Value
About This Home
This home is located at 142 Oakwood Creek Ln, Weatherford, TX 76088 and is currently estimated at $540,246, approximately $235 per square foot. 142 Oakwood Creek Ln is a home located in Parker County with nearby schools including Millsap Elementary School, Millsap Middle School, and Millsap High School.
Ownership History
Date
Name
Owned For
Owner Type
Purchase Details
Closed on
Mar 27, 2024
Sold by
Vaughn Michael and Vaughn Robin
Bought by
Leon Eric
Current Estimated Value
Home Financials for this Owner
Home Financials are based on the most recent Mortgage that was taken out on this home.
Original Mortgage
$506,969
Outstanding Balance
$498,275
Interest Rate
6.77%
Mortgage Type
FHA
Estimated Equity
$41,971
Purchase Details
Closed on
Aug 30, 2012
Sold by
Trinity Classic Homes Llc
Bought by
Vaughn Michael and Vaughn Robin
Home Financials for this Owner
Home Financials are based on the most recent Mortgage that was taken out on this home.
Original Mortgage
$222,887
Interest Rate
3.5%
Mortgage Type
FHA
Purchase Details
Closed on
Mar 13, 2012
Sold by
Ct Joint Venture
Bought by
Vaughn Michael and Vaughn Robin
Create a Home Valuation Report for This Property
The Home Valuation Report is an in-depth analysis detailing your home's value as well as a comparison with similar homes in the area
Home Values in the Area
Average Home Value in this Area
Purchase History
| Date | Buyer | Sale Price | Title Company |
|---|---|---|---|
| Leon Eric | -- | Providence Title Company | |
| Vaughn Michael | -- | None Available | |
| Vaughn Michael | -- | -- |
Source: Public Records
Mortgage History
| Date | Status | Borrower | Loan Amount |
|---|---|---|---|
| Open | Leon Eric | $506,969 | |
| Previous Owner | Vaughn Michael | $222,887 |
Source: Public Records
Tax History Compared to Growth
Tax History
| Year | Tax Paid | Tax Assessment Tax Assessment Total Assessment is a certain percentage of the fair market value that is determined by local assessors to be the total taxable value of land and additions on the property. | Land | Improvement |
|---|---|---|---|---|
| 2025 | $6,211 | $535,800 | $94,720 | $441,080 |
| 2024 | $6,211 | $437,745 | -- | -- |
| 2023 | $6,211 | $397,950 | $0 | $0 |
| 2022 | $6,864 | $361,780 | $40,000 | $321,780 |
| 2021 | $7,242 | $361,780 | $40,000 | $321,780 |
| 2020 | $6,808 | $316,430 | $40,000 | $276,430 |
| 2019 | $6,786 | $316,430 | $40,000 | $276,430 |
| 2018 | $6,239 | $267,420 | $30,000 | $237,420 |
| 2017 | $6,460 | $267,420 | $30,000 | $237,420 |
| 2016 | $6,064 | $251,040 | $30,000 | $221,040 |
| 2015 | $5,572 | $251,040 | $30,000 | $221,040 |
| 2014 | $5,487 | $239,680 | $30,000 | $209,680 |
Source: Public Records
Map
Nearby Homes
- 2435 Old Mineral Wells Hwy
- TBD Old Mineral Wells Hwy
- 103 Saddle Club Rd
- 167 Duke Trail
- 4025 Life Dr
- 4024 Life Dr
- 1061 Salvation Dr
- 100 Overton Ridge Cir
- 1033 Salvation Dr
- 2097 Redemption Dr
- 2068 Redemption Dr
- 109 Rio Bravo Ct
- 3024 Truth Ct
- 100 Rio Bravo Ct
- 1008 Salvation Dr
- 4710 Mineral Wells Hwy
- 1009 Salvation Dr
- 1057 Salvation Dr
- 1017 Salvation Dr
- 1035 Estancia Blvd
- 142 Oakwood Creek Ln
- 146 Oakwood Creek Ln
- 141 Oakwood Creek Ln
- 150 Oakwood Creek Ln
- 149 Oakwood Creek Ln
- 138 Oakwood Creek Ln
- 134 Oakwood Creek Ln
- 154 Oakwood Creek Ln
- 153 Oakwood Creek Ln
- 200 Oakwood Creek Ct
- 157 Oakwood Creek Ln
- 130 Oakwood Creek Ln
- 158 Oakwood Creek Ln
- 204 Oakwood Creek Ct
- 3380 Mineral Wells Hwy
- 161 Oakwood Creek Ln
- 212 Oakwood Creek Ct
- 162 Oakwood Creek Ln
- 201 Oakwood Creek Ct
- 166 Oakwood Creek Ln