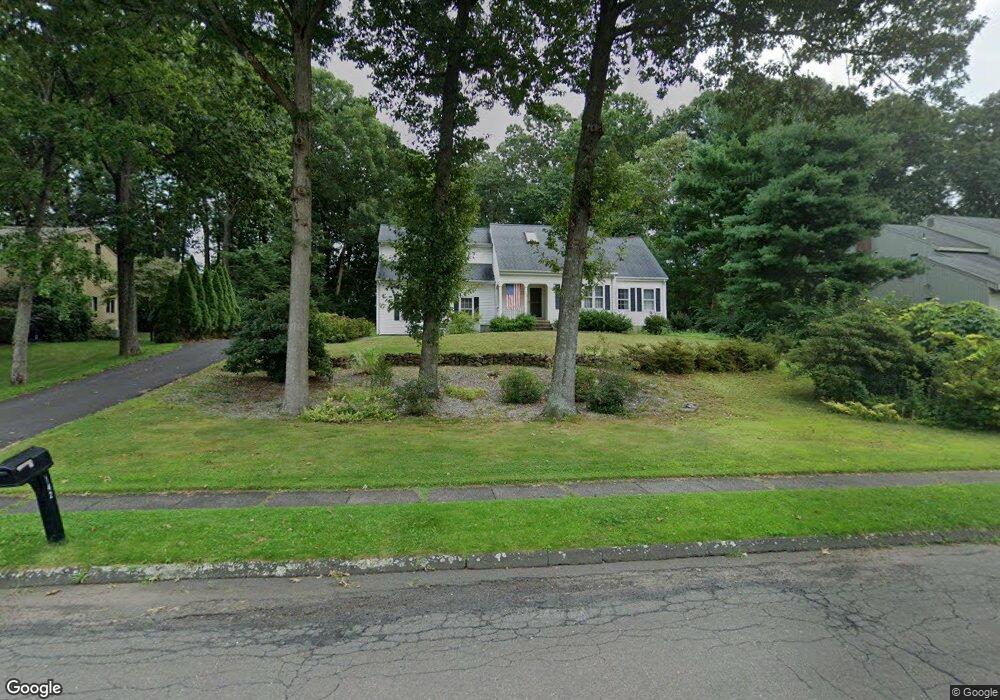
142 Olson Dr Southington, CT 06489
East Southington NeighborhoodEstimated Value: $587,795 - $663,000
3
Beds
3
Baths
2,290
Sq Ft
$275/Sq Ft
Est. Value
About This Home
This home is located at 142 Olson Dr, Southington, CT 06489 and is currently estimated at $630,699, approximately $275 per square foot. 142 Olson Dr is a home located in Hartford County with nearby schools including Reuben E. Thalberg Elementary School, Joseph A. Depaolo Middle School, and Southington High School.
Ownership History
Date
Name
Owned For
Owner Type
Purchase Details
Closed on
Sep 7, 2012
Sold by
Kryszak Sandi P
Bought by
Kryszak James F
Current Estimated Value
Home Financials for this Owner
Home Financials are based on the most recent Mortgage that was taken out on this home.
Original Mortgage
$253,400
Outstanding Balance
$175,342
Interest Rate
3.57%
Mortgage Type
Stand Alone Refi Refinance Of Original Loan
Estimated Equity
$455,357
Purchase Details
Closed on
Apr 19, 1991
Sold by
Smith Howard
Bought by
Ringquist Donald and Ringquist Robin
Create a Home Valuation Report for This Property
The Home Valuation Report is an in-depth analysis detailing your home's value as well as a comparison with similar homes in the area
Home Values in the Area
Average Home Value in this Area
Purchase History
| Date | Buyer | Sale Price | Title Company |
|---|---|---|---|
| Kryszak James F | -- | -- | |
| Ringquist Donald | $240,000 | -- |
Source: Public Records
Mortgage History
| Date | Status | Borrower | Loan Amount |
|---|---|---|---|
| Open | Ringquist Donald | $253,400 | |
| Previous Owner | Ringquist Donald | $183,000 | |
| Previous Owner | Ringquist Donald | $186,000 |
Source: Public Records
Tax History
| Year | Tax Paid | Tax Assessment Tax Assessment Total Assessment is a certain percentage of the fair market value that is determined by local assessors to be the total taxable value of land and additions on the property. | Land | Improvement |
|---|---|---|---|---|
| 2025 | $8,087 | $243,500 | $72,700 | $170,800 |
| 2024 | $7,656 | $243,500 | $72,700 | $170,800 |
| 2023 | $7,393 | $243,500 | $72,700 | $170,800 |
| 2022 | $7,093 | $243,500 | $72,700 | $170,800 |
| 2021 | $7,069 | $243,500 | $72,700 | $170,800 |
| 2020 | $7,267 | $237,260 | $74,190 | $163,070 |
| 2019 | $7,270 | $237,260 | $74,190 | $163,070 |
| 2018 | $7,232 | $237,260 | $74,190 | $163,070 |
| 2017 | $7,232 | $237,260 | $74,190 | $163,070 |
| 2016 | $7,032 | $237,260 | $74,190 | $163,070 |
| 2015 | $6,783 | $232,770 | $70,650 | $162,120 |
| 2014 | $6,601 | $232,770 | $70,650 | $162,120 |
Source: Public Records
Map
Nearby Homes
- 285 Queen St Unit 10I
- 285 Queen St
- 285 Queen St Unit 4F
- 273 Queen St Unit 9C
- 81 Laning St
- 288 Laning St
- 500 Darling St Unit 12J
- 25 Whippoorwill Rd
- 207 Lazy Ln Unit 11
- 166 Sun Valley Dr
- 63 Old Cider Mill Rd
- 76 Kane St
- 184 Hobart St
- 228 Pattonwood Dr
- 2 Forest St
- 1 Jensen Ct
- 619 Woodruff St
- 160 Flanders Rd
- 45 Quail Hollow Dr
- 4 Maple Rd
Your Personal Tour Guide
Ask me questions while you tour the home.