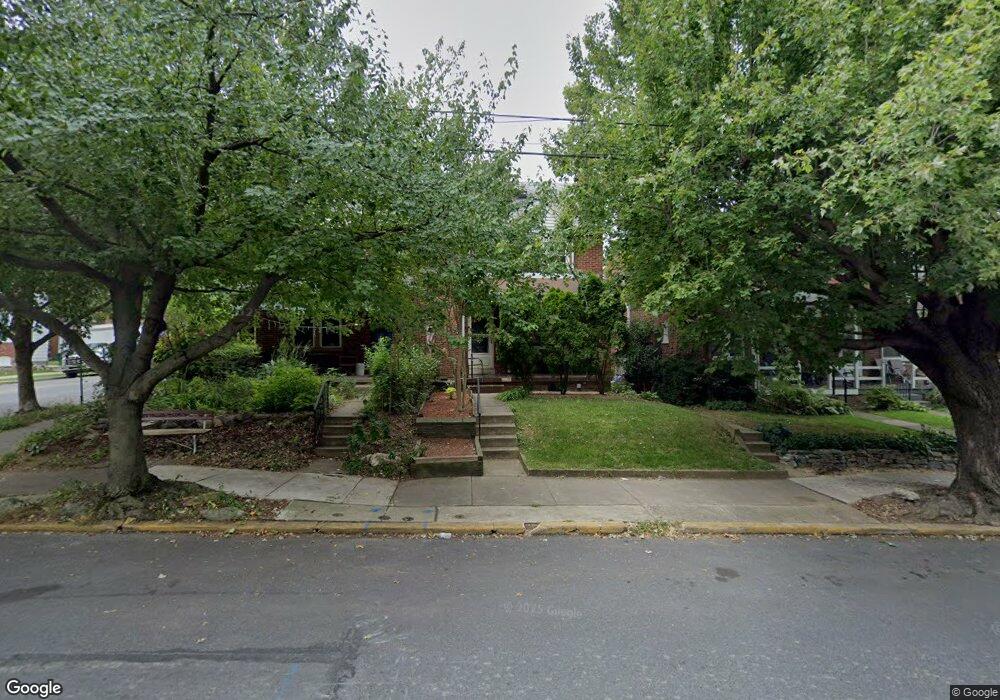
142 Ruby St Lancaster, PA 17603
West End NeighborhoodEstimated Value: $202,000 - $373,000
3
Beds
1
Bath
1,200
Sq Ft
$216/Sq Ft
Est. Value
About This Home
This home is located at 142 Ruby St, Lancaster, PA 17603 and is currently estimated at $259,310, approximately $216 per square foot. 142 Ruby St is a home located in Lancaster County with nearby schools including Smith-Wade-El Elementary School, Wheatland Middle School, and McCaskey High School.
Ownership History
Date
Name
Owned For
Owner Type
Purchase Details
Closed on
Jan 27, 2005
Sold by
Wall Daniel C
Bought by
Ndoci Mark
Current Estimated Value
Home Financials for this Owner
Home Financials are based on the most recent Mortgage that was taken out on this home.
Original Mortgage
$86,218
Outstanding Balance
$43,592
Interest Rate
5.67%
Mortgage Type
FHA
Estimated Equity
$215,718
Create a Home Valuation Report for This Property
The Home Valuation Report is an in-depth analysis detailing your home's value as well as a comparison with similar homes in the area
Home Values in the Area
Average Home Value in this Area
Purchase History
| Date | Buyer | Sale Price | Title Company |
|---|---|---|---|
| Ndoci Mark | $86,900 | First American Title Ins Co |
Source: Public Records
Mortgage History
| Date | Status | Borrower | Loan Amount |
|---|---|---|---|
| Open | Ndoci Mark | $86,218 |
Source: Public Records
Tax History
| Year | Tax Paid | Tax Assessment Tax Assessment Total Assessment is a certain percentage of the fair market value that is determined by local assessors to be the total taxable value of land and additions on the property. | Land | Improvement |
|---|---|---|---|---|
| 2025 | $3,609 | $91,200 | $23,500 | $67,700 |
| 2024 | $3,609 | $91,200 | $23,500 | $67,700 |
| 2023 | $3,548 | $91,200 | $23,500 | $67,700 |
| 2022 | $3,400 | $91,200 | $23,500 | $67,700 |
| 2021 | $3,327 | $91,200 | $23,500 | $67,700 |
| 2020 | $3,327 | $91,200 | $23,500 | $67,700 |
| 2019 | $3,278 | $91,200 | $23,500 | $67,700 |
| 2018 | $1,508 | $91,200 | $23,500 | $67,700 |
| 2017 | $3,564 | $77,600 | $27,100 | $50,500 |
| 2016 | $3,532 | $77,600 | $27,100 | $50,500 |
| 2015 | $1,378 | $77,600 | $27,100 | $50,500 |
| 2014 | $2,655 | $77,600 | $27,100 | $50,500 |
Source: Public Records
Map
Nearby Homes
Your Personal Tour Guide
Ask me questions while you tour the home.