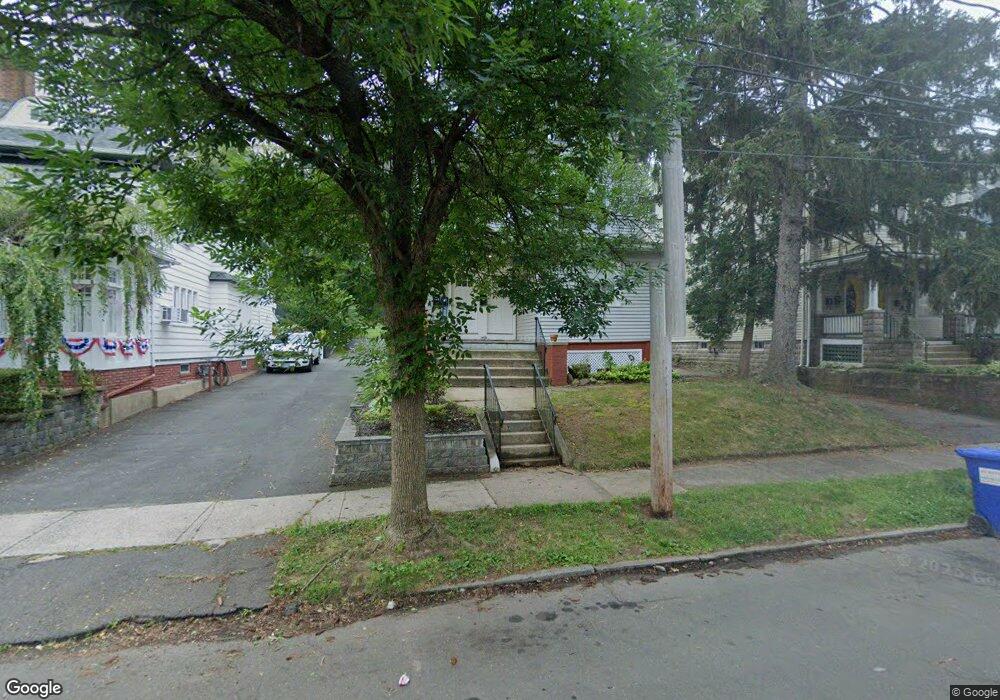
142 S Whittlesey Ave Wallingford, CT 06492
Estimated Value: $468,820 - $581,000
6
Beds
3
Baths
3,147
Sq Ft
$166/Sq Ft
Est. Value
About This Home
This home is located at 142 S Whittlesey Ave, Wallingford, CT 06492 and is currently estimated at $521,955, approximately $165 per square foot. 142 S Whittlesey Ave is a home located in New Haven County with nearby schools including Moses Y Beach Elementary School, Rock Hill Elementary School, and Dag Hammarskjold Middle School.
Ownership History
Date
Name
Owned For
Owner Type
Purchase Details
Closed on
Jul 7, 2020
Sold by
Zolnik Douglas F
Bought by
Edeen Erik
Current Estimated Value
Home Financials for this Owner
Home Financials are based on the most recent Mortgage that was taken out on this home.
Original Mortgage
$162,500
Outstanding Balance
$144,362
Interest Rate
3.2%
Mortgage Type
Purchase Money Mortgage
Estimated Equity
$377,593
Purchase Details
Closed on
Dec 24, 2002
Sold by
Becroft Scott M and Becroft Debra L
Bought by
Zolnik Douglas F
Purchase Details
Closed on
Dec 2, 1998
Sold by
Haddad Carlton F and Haddad Leona
Bought by
Becroft Scott M and Becrot Debra L
Create a Home Valuation Report for This Property
The Home Valuation Report is an in-depth analysis detailing your home's value as well as a comparison with similar homes in the area
Home Values in the Area
Average Home Value in this Area
Purchase History
| Date | Buyer | Sale Price | Title Company |
|---|---|---|---|
| Edeen Erik | $275,000 | None Available | |
| Edeen Erik | $275,000 | None Available | |
| Zolnik Douglas F | $215,000 | -- | |
| Zolnik Douglas F | $215,000 | -- | |
| Becroft Scott M | $160,000 | -- |
Source: Public Records
Mortgage History
| Date | Status | Borrower | Loan Amount |
|---|---|---|---|
| Open | Edeen Erik | $162,500 | |
| Closed | Edeen Erik | $162,500 | |
| Previous Owner | Becroft Scott M | $40,000 | |
| Previous Owner | Becroft Scott M | $227,500 |
Source: Public Records
Tax History Compared to Growth
Tax History
| Year | Tax Paid | Tax Assessment Tax Assessment Total Assessment is a certain percentage of the fair market value that is determined by local assessors to be the total taxable value of land and additions on the property. | Land | Improvement |
|---|---|---|---|---|
| 2025 | $7,991 | $331,300 | $91,100 | $240,200 |
| 2024 | $6,672 | $217,600 | $80,300 | $137,300 |
| 2023 | $6,384 | $217,600 | $80,300 | $137,300 |
| 2022 | $6,319 | $217,600 | $80,300 | $137,300 |
| 2021 | $6,206 | $217,600 | $80,300 | $137,300 |
| 2020 | $5,651 | $193,600 | $85,700 | $107,900 |
| 2019 | $5,651 | $193,600 | $85,700 | $107,900 |
| 2018 | $5,545 | $193,600 | $85,700 | $107,900 |
| 2017 | $5,527 | $193,600 | $85,700 | $107,900 |
| 2016 | $5,400 | $193,600 | $85,700 | $107,900 |
| 2015 | $5,214 | $189,800 | $84,000 | $105,800 |
| 2014 | $5,104 | $189,800 | $84,000 | $105,800 |
Source: Public Records
Map
Nearby Homes
- 180 S Whittlesey Ave
- 67 Spring St
- 148 Judd Square Unit 148
- 120 S Cherry St
- 210 S Elm St
- 15 Marshall St
- 39 Hoffman Ct Unit B3
- 530 Center St Unit C1
- 43 Academy St
- 85 N Colony St
- 109 Clifton St
- 29 Curtis Ave
- 26 West St
- 333 S Elm St
- 120 Grandview Ave
- 6 Holly Ln
- 49 High St
- 30 Clinton Place
- 40 Lake St
- 19 Carriage Dr
- 138 S Whittlesey Ave
- 146 S Whittlesey Ave
- 136 S Whittlesey Ave
- 150 S Whittlesey Ave
- 334 Ward St
- 132 S Whittlesey Ave
- 151 S Whittlesey Ave
- 128 S Whittlesey Ave
- 128 S Whittlesey Ave Unit 2
- 128 S Whittlesey Ave Unit 3
- 143 S Whittlesey Ave
- 147 S Whittlesey Ave
- 139 S Whittlesey Ave
- 338 Ward St
- 164 S Whittlesey Ave
- 329 Ward St
- 133 S Whittlesey Ave
- 302 Ward St
- 302 Ward St Unit 1ST
- 124 S Whittlesey Ave